Well, at least according to the WSJ and Steven Russolillo. What is his evidence? The P/E ratio of course.
“Nine of the 10 biggest S&P 500 companies currently trade at price-to-earnings ratios of less than 20, according to Bespoke Investment Group. At the peak of the tech bubble in March 2000, none of the 10 largest companies were that cheap, suggesting the irrational exuberance that infiltrated the market back then hasn’t come close to making a comeback now.”
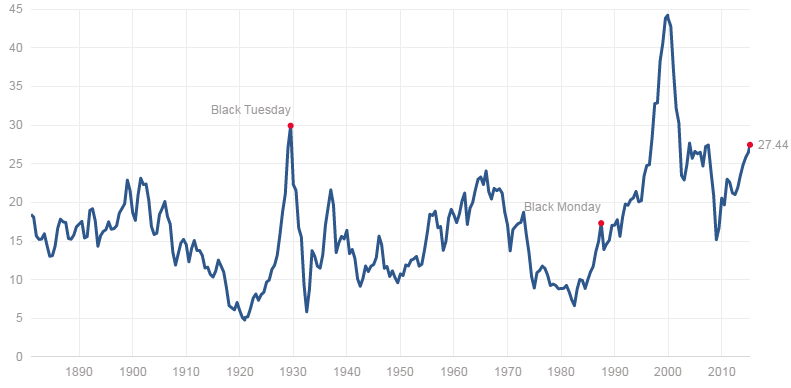
I am not sure how many times I have to explain this stupidity away, but let me give it another try. Take a look at the P/E chart below. The P/E ratio is no longer relevant in today’s macroeconomic environment where the FED floods the market with cheap credit. You see, most of the corporate earnings (the E in P/E) have been driven by this same credit. If you take away the low interest rates and over $1 Trillion of stimulus that was pumped into our economy over the last 3 years, you will see this E collapse. Making today’s P/E ratio not only expensive, but “are you fu&#ing kidding me expensive”.
That is exactly what happened at the market top in 2007 when the S&P P/E ratio went from about 18 at the top in 2007 to 128 in 2008. How is that possible? Well, the earnings that were driven by credit and speculation at 2007 top simply vanished. Today we face an identical situation. The bottom line is this. Anyone who relies on the P/E ratio to “value the markets” in today’s environment will lose a lot of money.

Did you enjoy this article? If so, please share our blog with your friends as we try to get traction. Gratitude!!!

Click here to subscribe to my mailing list
No Stock Market Bubble, All Bears Are Idiots Google
Morning MoneyBeat: No Bubble Here
Warnings of an impending stock-market bubble are everywhere. But one important, and perhaps underrated, indicator says investors shouldn’t worry so much.
Nine of the 10 biggest S&P 500 companies currently trade at price-to-earnings ratios of less than 20, according to Bespoke Investment Group. At the peak of the tech bubble in March 2000, none of the 10 largest companies were that cheap, suggesting the irrational exuberance that infiltrated the market back then hasn’t come close to making a comeback now.
In 1999 and 2000 when the market zoomed to uncharted territory, the bubble started in tech stocks and then spread through the rest of the market. It lifted tech companies to exorbitant valuations and pushed the overall market to historically expensive levels. But now, the fact that valuations among the biggest companies remain in-line or even below historic averages highlights how pockets of frothiness haven’t had the same impact on the broad market.
The top 10 companies, on average, currently trade at 16.1 times trailing earnings, Bespoke’s data show. In March 2000 the 10 biggest firms had an average P/E multiple of 62.6, almost four times the current amount.
Apple Inc., Exxon Mobil Corp. and Microsoft Corp.—three of the S&P 500’s four biggest companies right now—all sport P/E ratios around 13, well below the S&P 500’s trailing P/E ratio of 18.09. Wells Fargo, Wal-Mart andJ.P. Morgan also have cheaper multiples than the broader market. The priciest stock in the top 10 is Google Inc., which trades at 33 times earnings.
To put those numbers in perspective, Google’s current valuation would’ve ranked as the third cheapest among the S&P 500’s top 10 biggest companies in March 2000.
The go-go days of the dot-com boom were much different than today. Consider some of the valuation metrics: Microsoft, then the biggest company, traded at 56.8 time trailing earnings. Cisco Systems had a P/E ratio of 196.2 and Oracle traded at 148.4 times trailing earnings. The cheapest of the top 10 was Exxon Mobil, which had a P/E ratio of 24.6. That would rank as the second priciest among today’s top 10.
“Back in 2000, many of the technology stocks that were part of the bubble were also among the largest companies in the U.S. in terms of market cap,” Paul Hickey, cofounder at Bespoke Investment Group, wrote to clients. “When the bubble stocks popped, they dragged down the entire index along with them.”
In 2014 some pockets of the market, such as biotech and social media, look particularly frothy. But even if those groups fall substantially, they aren’t big enough to bring the rest of the market lower. “A large decline in fuel-cell, marijuana, or even social-media stocks is unlikely to be a major market moving event,” Mr. Hickey says.
To be sure, the bubble warnings flying around Wall Street shouldn’t be ignored. We’ve cited several of them recently, including pricey stock valuations and record high margin-debt levels. Investors have also been pushing stocks of newly public companies higher even as a growing number of them aren’t profitable.
But the message from America’s biggest companies isn’t flashing concern just yet. That’s far different from what transpired 14 years ago.
Morning MoneyBeat Daily Factoid: On this day six years ago, gold prices on the New York Mercantile Exchange hit $1,000 an ounce for the first time ever.


