InvestWithAlex.com 

Will The War In Ukraine Collapse The US Financial Markets?

The Dow Jones gapped down at the open to the tune of -130 points. Raising the question if the potential war in Ukraine and the continued escalation of tension between Russia and the US will be enough to set off a large bear market move. Based on my mathematical timing work the answer is YES and NO. The gap we see at today’s open is likely to be closed. Either today or over the next few days. It is my belief that the market will settle down to continue it’s present trend, but not for too much longer. While the trouble in Ukraine could be blamed as the catalyst that sets the upcoming bear market off, such is not the case. Again, the market is tracing out it’s exact structure. It will start the bear market when the time is right.      

When is that time?

Check out our Subscription section. 

z6

NEW YORK (Reuters) – U.S. stocks were set to open sharply lower on Monday, alongside other risk assets, as Ukraine and Russia prepared for war after Russian President Vladimir Putin declared he had the right to invade his neighbor.

Ukraine mobilized for war on Sunday and Washington threatened to isolate Russia economically after Putin said he had the right to invade Ukraine, in Moscow’s biggest confrontation with the West since the Cold War.

The S&P 500 closed at a record high on Friday, and profit taking was expected on Wall Street due to the political uncertainty.

“There’s been a very significant rally,” said Rick Meckler, president of investment firm LibertyView Capital Management in Jersey City, New Jersey.

“If you need an excuse to sell, this is a good one.”

Russian stocks and bonds fell sharply and the central bank hiked interest rates to defend the ruble.

Energy stocks could stand to lose if relations between the United States and Russia deteriorate further. Volatility will likely spike alongside the uncertainty of the situation.

“Anything that involves a boycott of Russian supplies, which are very significant, could impact the energy sector dramatically,” said Meckler.

“In situations like this you see very quick reactions reverse as people understand the scenario and how things play out.”

S&P 500 e-mini futures fell 17 points and were below fair value, a formula that evaluates pricing by taking into account interest rates, dividends and time to expiration on the contract. Dow Jones industrial average futures fell 130 points and Nasdaq 100 futures lost 34 points.

Gold prices hit a four month high as investors sought safe-haven assets, boosting gold stocks.

Though the focus will likely remain on Ukraine, the economic calendar is full on Monday.

U.S. consumer spending rose more than expected in January, likely as chilly weather boosted demand for heating.

Will The War In Ukraine Collapse The US Financial Markets?  Google

What You Ought To Know About This Secular Bear Market. Plus, Weekly Market Update.

daily chart Feb 28, 2014

Weekly Update & Summary: February 28th, 2014

The market continued its bull move with the Dow Jones being up +218 points (1.36%) and the Nasdaq being up +44 points (1.05%) for the week. Structurally, the market did very well, leaving only one gap behind….at 16,100. There are still a number of gaps going all the way down to 15,500 on the Dow, but all of them will be closed during the upcoming bear market leg.   

FUNDAMENTAL & MARKET ANALYSIS: 

During the week Charles Schwab Chief Investment Strategist, Liz Ann Sonders, claimed that the bull run stocks have enjoyed for the last five years is not over yet. According to her, “I think what started five years ago was the beginning of a secular bull market, not just a cyclical bull within an ongoing bear.”   

This is an important claim that we must discuss. This will help me explain, once again, where we are in the cycle. If you are not familiar with the terminology….

Secular Bull Market ……. is a long term bull market. For example, what we saw between 1982-2000.

Cyclical Bull Market Within Ongoing Bear…..is a bear market rally. For instance, the move between 2002/03 bottom to 2007 top.

So, what she is saying is that the bear market that started in January of 2000 is now over and that the new long term bull market started at 2009 bottom. There is just one problem with her statement.

Liz Ann Sonders didn’t do her market homework. Since the stock market officially “opened” in May of 1790 there hasn’t been a single bear market that lasted 9 years. Not a single one if you understand the cyclical composition and market structure. Why would it be different this time? It is not.

In fact,  the market oscillates in bull and bear market cycles that on average last 17-18 years. There is a reason for that, but let me illustrate instead of telling you. Let’s take a closer look

Long Term Dow Structure3

  • 1897-1914 Bear Market. (17 Years).
  • 1914-1932 Bull Market. (18 Years). * Please note, the last 3 years of this cycle 1929-32 we had a cycle inversion. I will talk about it in my future writings, for now, its outside the scope of our discussion.
  • 1932-1949 Bear Market (17 Years).
  • 1949-1966 Bull Market ( 17 Years).
  • 1966-1982 Bear Market (17 Years).
  • 1982-2000 Bull Market (18 Years).
  • 2000-2009 Bear Market ? ….I don’t think so….

As you can clearly see, bull and bear markets alternate in 17-18 year cycles. Any notion that, somehow, this bear market was only 9 years long and we are now in a cyclical bull market is ludicrous.  

This is further confirmed by my mathematical work. What we have seen between March 2009 bottom and today was a simple bear market rally, even if it did set a new high. It was a 5 year cycle (exactly the same as in 2002-2007) and it is now done. Cyclical bear markets tend to finish off with a 2-3 year down moves and that is, once again, being confirmed by my calculations.

I have stated on numerous occasions that the stock market has topped out on December 31st, 2013, ushering in the final leg of the bear market. When this bear market completes the Dow Jones will be well below it’s 2000 top of 11,800……essentially tracing out a flat move over an 17 year period of time. Exactly what a bear market should look like.

I hope this brings further awareness and understanding of where we are in this economic and market cycle. If you want more precise timing capability, please take a look at our Timing Analysis section below.

MACROECONOMIC ANALYSIS:  

One word. Ukraine.

As I have mentioned in one of my posts during the week, there is absolutely no way in hell that Russia will let Ukraine go.  What we are seeing today is indicative of that stand.  If you are not following the story, here is what had transpired.  The EU Bureaucrats and the US Government have decided that it would be a good idea to destabilize Ukraine after Ukrainian government decided to go forward with Russia instead of joining the EU or NATO.  Thus far, the western governments were successful it toppling Ukrainian President and “claiming victory”.

However, here is what even a retarded CIA/NSA analyst should understand. Russia will never let Ukraine go.  It will go to war over that territory if need be and that is exactly what we are seeing today. Obama coming out and “WARNING” Russia does nothing but infuriate Russia even more. Again, the US Government has no business in Ukraine.  Ukraine is a split nation and when Obama talks about the “Ukrainian People who want freedom and closer ties to the EU” he talks about 25% of Ukrainian population at best.  The bottom line is this, Russia will take it and no one will stop it.

Is this important? Will this impact our financial markets?  While it will not have any impact on the US financial markets  (outside the spectrum of our forecasts) it is an incredibly important geopolitical event. It is quite possible that when we look back, this event will be indentified as the beginning of the Cold War II between Russia and the West. With one big difference. Russia will have an incredibly strong partner on its side that it didn’t have last time…..China.  This is a fascinating development that will impact us all over the next few decades.

TECHNICAL ANALYSIS: 

While the overall technical picture is clearing up.

Long-Term: The trend is still up. Market action in January-February could be viewed as a simple correction in an ongoing bull market. 

Intermediary-Term: Since February 5th, intermediary term picture shifted from negative to positive. Giving us a technical indication that both the intermediary term and the long term trends are up. Yet, that in itself can be misleading as per our timing analysis discussion below.

Short-Term: Short-term trend has turned bullish as well.

While all 3 trends are bullish, this might be misleading. Please read our Mathematical and Timing Analysis to see what will transpire over the next few weeks.    

MATHEMATICAL & TIMING ANALYSIS:  

(*** Please Note: About 75% of the information contained within this section has been deliberately removed. Particularly, exact dates and prices of the upcoming turning points. As well as trading forecasts associated with them. I deem such information to be too valuable to be released onto the general public.  As such, this information is only available to my premium subscribers. If you are a premium subscriber please Click Here to log in. If  you would be interested in becoming a subscriber and gaining access to the most accurate forecasting service available anywhere, a forecasting service that gives you exact turning points in both price and time, please Click Here to learn more.Subscription is through lottery only. Don’t forget, we have a risk free 14-day trial). 

I continue to believe that March will be a very volatile month. We have a number of interference patterns in play, indicating a number of strong and powerful bull/bear moves. With that said, I believe Friday’s market action has cleared a lot of question marks. Primarily, XXXX. 

In addition, the market closed two important gaps all the way up to 16,400 that were left there in January. I have talked about these gaps on numerous occasions, suggesting that the market must close said gaps before any meaningful bear market can start. That was done today, clearing the way for the market to XXXX

While there are a number of important turning points in March (indicating interference), there is one particular price point that works very well. As such, I propose the following turning points.

Date: XXXX
Price Target: XXXX

Explanation: XXXX

Hence, I suggest the following positioning over the next few days/weeks to minimize the risk while positioning yourself for a forecasted market action.

If You Are A Trader: XXXX

If No Position: XXXX

If Long: XXXX

If Short:  XXXX

CONCLUSION: 

We have a couple of existing and challenging weeks coming up. March of 2014 presents us with numerous high probability turning points. Indicating volatility, multiple interference patterns and an incredibly important long-term XXXX. Those anticipating the moves and those who can time them properly will be rewarded appropriately. Once the moves described above play out in full, the market will be set free to continue its next cyclical bear market leg. 

Please Note: XXXX is available to our premium subscribers in our + Subscriber Section. It’s FREE to start. 

Did you enjoy this article? If so, please share our blog with your friends as we try to get traction. Gratitude!!!

What You Ought To Know About This Secular Bear Market. Plus, Weekly Market Update.  Google

Will This Stock Go Up 500% Over The Next 3 Years?

Rite Aid Corporation (RAD)

Investment Thesis Summary: Rite Aid is a “turnaround” undervalued stock with a significant upside potential.  Due to improved company fundamentals and performance the stock price is up 550% over the last 1.5 years. Yet, I believe the company’s stock continues to be undervalued. It is still far from where it could be if the company continues to execute its turnaround plans.  In fact, based on today’s valuation metrics, if Rite Aid is to approach  the valuation metrics and margins of its competitors over the next 3-5 years, Rite Aid’s stock should appreciate 2-5X from today’s price.

THE STORY:

Please click on this presentation to learn about the company, future plans and their turnaround story.

The company has a number of things going for it.

1. Aging Population

This is straight forward and self explanatory.  According to US Census Bureau the population of those 65 & Older in the US will be at 56 Million by 2020. That is about a 40% increase from today’s levels. It doesn’t take a genius to figure out that these older Americans will be visiting Rite Aid more often to buy larger quantities of drugs as they continue to age. Driving sales and profitability higher.

2. Drug Deal/Distribution

In mid February 2014 The company announced an expanded distribution agreement with McKesson (MCK), a massive drug retailer.  While this renewal is technically an expansion of their existing deal into 2019 it gives us an important clue to future growth and profitability.

The drug industry is changing. Today, most drugs are bought in massive quantities by the likes of distributors like McKesson. This gives both McKesson and Rite Aid higher pricing power and flexibility. In addition, the so called “Patent Cliff is in play. It is estimated that between 2011 and 2017 close to $130 billion worth of brand drugs will lose patent protection and become generic. When that happens, the margins for both pharmacies and drug distributors should increase further.

That is already becoming evident at McKesson where operating margins have risen from 1.63% to 2.03%  since 2011 and at Rite Aid where operating margins went from (-2.16%) to +3.76% over the same period of time. As you can see a massive jump.  As more generic drugs come on the market over the next few years, it is likely the operating margin will continue to expand.

3. Turn Around/Improved performance

rad1


rad2

Please see the presentation for other data points on turnaround and improved performance. Click Here

4. Undervaluation:

I believe that standard Intrinsic Value  Calculation/Valuation will not yield very good results in this case because the company is in the process of a turn around. To determine future valuation and  potential undervaluation  at this time, we must look at properly run competitors. Walgreen Co (WAG) and CVS Corp (CVS) in particular. We have to look at their existing valuation and assume that Rite Aid will move closer to such industry valuation metrics as it continues its turnaround plans.

The easiest way to do so is to look at  Price/Sale Ratio.  Again, the assumption here is that Rite Aid will continue to execute on its turnaround plan to reach industry metrics. Walgreen has a P/S ratio of 0.87 and CVS has a P/S ratio of 0.67

What does  it all mean?

It means that if Rite Aid continues to execute its turnaround plan and reaches industry metrics over the next 3-5 years, its stock price should be between $17.10 and $22.10. Giving us a respective yield of 158% and 233% over the next 3-5 years. With any other operating or margin improvements the return should be much higher.  

FUNDAMENTALS:

The stock is undervalued relative to today’s market.

Valuation Measures


Market Cap (intraday)5:

6.48B

Enterprise Value (Feb 25, 2014)3:

12.61B

Trailing P/E (ttm, intraday):

22.87

Forward P/E (fye Mar 2, 2015)1:

19.71

PEG Ratio (5 yr expected)1:

0.54

Price/Sales (ttm):

0.25

Price/Book (mrq):

N/A

Enterprise Value/Revenue (ttm)3:

0.50

Enterprise Value/EBITDA (ttm)6:

9.28


Financial Highlights


Fiscal Year

Fiscal Year Ends:

Mar 2

Most Recent Quarter (mrq):

Nov 30, 2013


Profitability

Profit Margin (ttm):

1.25%

Operating Margin (ttm):

3.76%


Management Effectiveness

Return on Assets (ttm):

8.32%

Return on Equity (ttm):

N/A


Income Statement

Revenue (ttm):

25.38B

Revenue Per Share (ttm):

28.01

Qtrly Revenue Growth (yoy):

1.90%

Gross Profit (ttm):

7.32B

EBITDA (ttm)6:

1.36B

Net Income Avl to Common (ttm):

280.41M

Diluted EPS (ttm):

0.29

Qtrly Earnings Growth (yoy):

15.60%


Balance Sheet

Total Cash (mrq):

183.21M

Total Cash Per Share (mrq):

0.19

Total Debt (mrq):

5.95B

Total Debt/Equity (mrq):

N/A

Current Ratio (mrq):

1.73

Book Value Per Share (mrq):

-2.31


Cash Flow Statement

Operating Cash Flow (ttm):

728.27M

Levered Free Cash Flow (ttm):

161.00M

The company financials are ugly, but getting better. If we are to look at the balance sheet, income statement and the cash flow statement the desire to invest is likely to disappear. However, we must be aware that by the point the financial statements will reflect improvement and return to stability, the stock price is likely to complete most of its climb.

What is the Intrinsic Value?  Too many variables and unknowns to calculate here. I believe the values provided in the “Undervaluation” section above make a lot more sense in this particular situation.

TECHNICAL:  

riteaid

As you can see, the technical picture is incredibly strong here. Since its bottom 1.5 years ago, the stock has appreciated over 550% with no signs of a technical slow down and/or a reversal.  Giving us an indication that most investors believe the turnaround story is developing (at this time) as this report suggests.

CONCLUSION, TIMING & POSITIONING:

XXXX

Please Note: XXXX is available to our premium subscribers in our + Subscriber Section. It’s FREE to start. 

Did you enjoy this article? If so, please share our blog with your friends as we try to get traction. Gratitude!!!

Will This Stock Go Up 500% Over The Next 3 Years?  Google

Idiots At The Gate. Plus, Weekly Stock Market Update & Forecast

daily chart Feb 22, 2014

Weekly Update & Summary: February 22nd, 2014

The market remained relatively flat for the week with the Dow Jones losing -51 points (-0.32%) while the Nasdaq gained 19 points (+0.46) Structurally, the market did very well, closing all the gaps during the span of the week.  There is still a gap left around 15,500 on the Dow, but it will be closed during the subsequent bear market leg.   

Fundamental & Market Analysis:

Over the last couple of years I have argued, sometimes passionately, that the Federal Reserve doesn’t really know what is going on within our own economy and our financial markets. Not only that, but I have also argued that they are a bunch of idiots and fools who believe that they can somehow control our financial markets.

If recently released transcripts, generated during the 2008 meltdown don’t prove my point of view without a shadow of a doubt, I don’t know what will. Here are just a few quick points from the said transcripts.

  • They didn’t even realize recession was happening until the 4th quarter of 2008. By that point the stock market has completed 80% of its down move.  In fact, for most of 2008 they thought the recession “could be avoided”.

—-Hello???? Was anyone home??? Recession started in Q4 of 2007.

  • Bernanke talked about pent-up demand for housing as late as January 2008.
  • Bernanke was worried about inflation as late as January 2008.
  • Throughout Q1 of 2008 they have held a generally rosy view of the world and the US Economy

Here are the links to two great articles about the transcripts if you would like to learn more. Click Here and/or Click Here

bernanke meme

The lesson here is twofold.

First, anyone who believes that the FED can either control, anticipate or predict financial markets and/or the economy is even a bigger fool.  Neither Bernanke nor Yellen can predict the economy even if it hit them in the face with a brick. All they can do is look at past data and say “Oh, look, according to this data recession started in Q4 of 2007”. What a waste of time and money.  

Second, they will always be behind the ball. They will always be a reactionary force as opposed to market makers. Take today’s environment for example. They are cutting QE and talking about raising the interest rates at exactly the wrong time. The damage from their crazy liquidity party has already been done. The worst thing they can do now is cut it. The faster they do it the faster the markets will collapse.  

Why is any of this important?

Well, if you rely on FED to make money in the stock market and/or run your own business it becomes incredibly important. As such, no one should rely on any action by the FED as an investment indicator. It is as simple as that.

This brings us to financial markets and my premise that financial markets behave exactly as they should. Many people would argue that it was the FED’s actions that put the bottom in at the March of 2009 juncture, ensuring a subsequent and massive stock market rally.

WRONG.

Don’t confuse cause and effect. It was the market that made the FED’s look good and not the other way around. The market was structured to bottom on March 6th, 2009 at 6,469 and then have a subsequent 5-year market rally. It was the mid-cycle bottom (half point of bear market) and I predicted it as early as January of that year. I was 1 day and 100 points away. Close enough. I know I have shown this chart before, but let’s take another look.

Long Term Dow Structure35

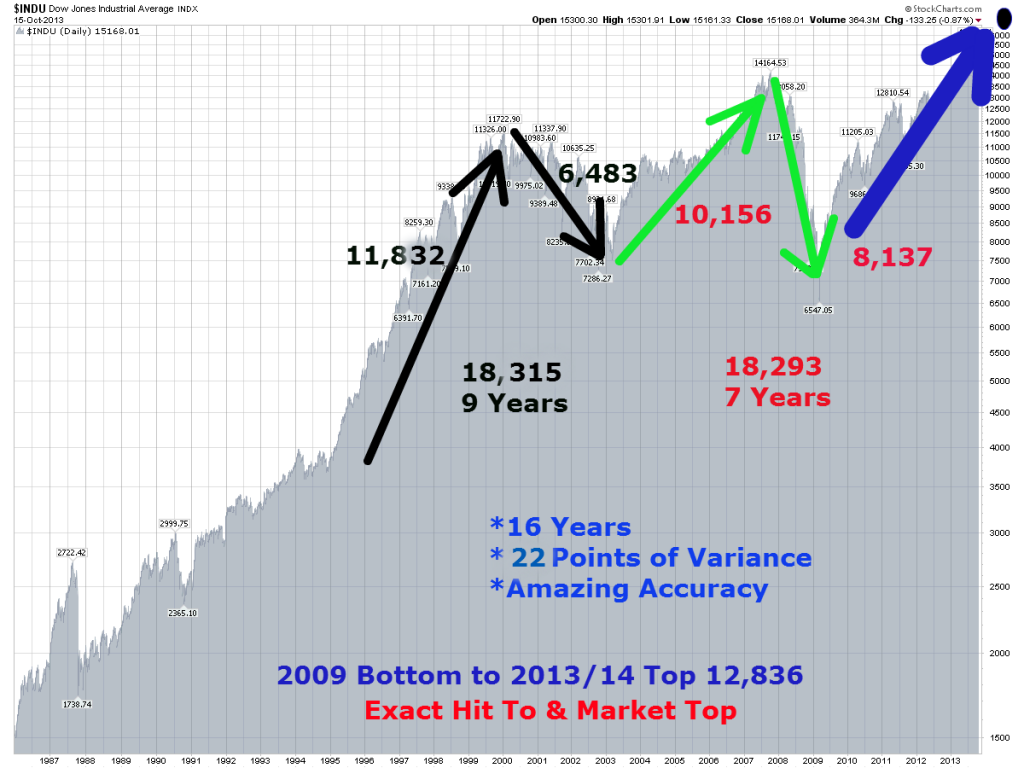
If you perform the type of 3-dimensional analysis that I do you would know that the move between 2003 bottom and 2009 bottom would be IDENTICAL to the move between 1994 bottom and 2002 bottom. And so it was, exhibiting a variance of 22 3-dimensional units (equivalent to a few trading days or 100 points).

Any analyst working with this information would know that as soon as 2007 top was confirmed that the next move down would be exactly 8,130 3-dimensional units. Once the market developed further, the same analyst would be able to pin point the exact bottom with amazing precision and that is what I want you to understand without a shadow of a doubt. The stock market is not volatile or random, it is exact and precise.

Same thing applies to today’s market. In last week’s forecast I identified a turning point in February. While I am not yet at liberty to discuss this turning point (available to premium subscribers only), it clearly explains the market action we have witnessed over the last couple of days. By concentrating on mathematics and 3-dimensional analysis one can pick out turning points with a precision of a surgeon.    

Macroeconomic Analysis: 

In a nutshell, Ukraine, Venezuela, Argentina and China. Argentina is on a verge of another default and I wrote about it before. Ukraine and Venezuela are both in the midst of violent revolutionary uprisings. While Venezuela will not have that much impact either way, Ukraine’s situation will have vast repercussions across the globe. Maybe not in economic terms, but certainly in geopolitical risk. All because of Russia. Having been born in Russia, let me tell you something. Russia is pissed off….big time.

They are pissed at a blatant American and EU interference into Russia’s business. Yes, Ukraine is Russia’s business. Always was and always will be. Just to give you a reference point, there would be a similar type of a reaction from the US if Russia was interfering in governance of Kentucky. Now, let’s take the “Ukranian people deserve freedom too and the US will go to any length necessary to see it happen” bullshit off the table. If you believe this crap, I have a $20 million bridge to sell you (give me a call).

What you see happening is the beginning of the next Cold War where both the US and Russia keep tearing into each other. With the only winners being the politicians and the military industrial complex. This is a negative development that should be watched carefully going forward. 

China’s shadow lending system continues to expand at breakneck speeds. No-one really knows for sure how big a problem China’s economy will eventually face due to the massive credit and money supply growth over the last few years. Since 2008 financial meltdown in particular. While no one has the real numbers, some of the estimates coming out of China are truly mindboggling. For instance, that China’s banking sector is now roughly the size of the US banking sector. With one primary difference. It took the US over 100 years of trial and error to get to that size, it took China roughly 5 years. Thus far China has been able to keep trouble at bay, but this is unlikely to continue much longer. Some sort of a blow up in China is imminent.

Technical Analysis: 

While the overall technical picture continues to remain murky, the resolution should be just around the corner.

Long-Term: The trend is still up. Market action in January-February could be viewed as a simple correction in an ongoing bull market. 

Intermediary-Term: Since February 5th, intermediary term picture shifted from negative to positive. Giving us a technical indication that both the intermediary term and the long term trends are up. Yet, that in itself can be misleading as per our timing analysis discussion below.

Short-Term: Is somewhat bearish. Please view our mathematical and timing analysis below for further understanding and explanation.

Mathematical & Timing Analysis: 

(*** Please Note: About 75% of the information contained within this section has been deliberately removed. Particularly, exact dates and prices of the upcoming turning points. As well as trading forecasts associated with them. I deem such information to be too valuable to be released onto the general public.  As such, this information is only available to my premium subscribers. If you are a premium subscriber please Click Here to log in. If  you would be interested in becoming a subscriber and gaining access to the most accurate forecasting service available anywhere, a forecasting service that gives you exact turning points in both price and time, please Click Here to learn more.Don’t forget, we have a risk free 14-day trial). 

Last week we concentrated on February XXXX, as a turning point. Here is the forecast that was provided.

Date: XXXX
Price: XXXX

Thus far, the vertical rally that started on February 5th ran into a brick wall. To be exact, the Dow topped out 1 hour into trading on February 19th at 16,225 and then proceeded to collapse 200 points.  Recovering thereafter and subsequently oscillating without going anywhere.  

So, what is going on? Have we hit our turning point?

XXXX

Hence, I suggest the following positioning over the next few days/weeks to minimize the risk while positioning yourself for a forecasted market action.

If You Are A Trader: XXXX  

If No Position: XXXX 

If Long: XXXX

If Short:  XXXX. 

CONCLUSION: 

We have an existing couple of weeks coming up. The week of February 24-28th should finally confirm February XXXX as a turning point. In March, we should see a number of big and very important turning points. I will start talking about them once the current stock market action resolves itself. Those anticipating the moves and those who can time them properly will be rewarded appropriately. Once the moves described above play out in full, the market will be set free to continue its next cyclical bear market leg. 

Please Note: XXXX is available to our premium subscribers in our + Subscriber Section. It’s FREE to start. 

Did you enjoy this article? If so, please share our blog with your friends as we try to get traction. Gratitude!!!

Idiots At The Gate. Plus, Weekly Stock Market Update & Forecast Google

Who Is Killing The JP Morgan Bankers? Plus, Market Update

As they say, real life is sometimes stranger than fiction. If you haven’t been paying attention, a number of high profile bankers have committed “suicide” over the last 30 days. Mostly, by “jumping” from the rooftops of their office towers. Seven of them to be exact (please see the list below) With three of them being from the JP Morgan Chase.

So, is there something in the air that is forcing these otherwise wealthy bankers at the prime of their career to commit suicide? Did we have a 1929 style market crash or is that a new termination policy at the major banks? Am I missing something here? 

Any notion that all of the said bankers have committed suicide is laughable. Take Richard Talley for instance, who ended up shooting himself 8 times with a nail gun in both torso and head. How is that even possible?  Plus, with multiple connections between the dead bankers, particularly those working at JP Morgan Chase, something doesn’t add up.  

Recently Madoff acknowledge that top brass at JP Morgan knew about his Ponzi scheme for over 10 years. Letting it go on and collecting massive fees in the process. This was part of a $2 Billion settlement JPM reached a few months back. So, is JPM terminating its own employees or is this a hit ordered by someone? 

Here are my two cents. I don’t think JPM has anything to do with this, but I do believe the people in question have found themselves on the wrong side of a trade or they have screwed someone. Big time. Perhaps an organized crime group, maybe a government. Basically, they took someone’s money (whether legitimately or not) and that someone put a hit on them. Simple as that. Just another point of reference that Wall Street is turning into a war zone. 

The lesson for Wall Street bankers is as follows. Next time you screw most of the world out of billions of dollars (mortgage backed meltdown), there might be people, organizations or governments out there crazy enough to put a hit out on you.

One thing is for sure, dead bankers don’t talk. 

jpmorgan_man on ledge

List of dead bankers

-Li Jie – 33 year old investment banker at JP Morgan jumped to his death from the roof of the bank’s headquarters in Central Hong Kong yesterday. Witnesses said the man went to the roof of the 30-storey Chater House in the heart of Hong Kong’s central business district and, despite attempts to talk him down, jumped to his death.


– On January 26, former Deutsche Bank executive Broeksmit was found dead at his South Kensington home after police responded to reports of a man found hanging at a house. According to reports, Broeksmit had “close ties to co-chief executive Anshu Jain.”


– Gabriel Magee, a 39-year-old senior manager at JP Morgan’s European headquarters, jumped 500ft from the top of the bank’s headquarters in central London on January 27, landing on an adjacent 9 story roof.


– Mike Dueker, the chief economist at Russell Investments, fell down a 50 foot embankment in what police are describing as a suicide. He was reported missing on January 29 by friends, who said he had been “having problems at work.”


– Richard Talley, 57, founder of American Title Services in Centennial, Colorado, was also found dead earlier this month after apparently shooting himself with a nail gun.


– 37-year-old JP Morgan executive director Ryan Henry Crane died last week.


– Tim Dickenson, a U.K.-based communications director at Swiss Re AG, also died last month, although the circumstances surrounding his death are still unknown.


MARKET UPDATE: 

2/20/2014 A strong rally from yesterday’s bottom with the Dow Jones appreciating +93 points (0.58%) and the Nasdaq climbing 29 points  (0.70%). 

Today is the perfect example of why we should wait for a market confirmation before committing to either going long or going short. Has anything changed since our proposed turning date of XXXX….. 

(*** Please Note: About 75% of the information contained within this section has been deliberately removed. Particularly, exact dates and prices of the upcoming turning points. As well as trading forecasts associated with them. I deem such information to be too valuable to be released onto the general public.  As such, this information is only available to my premium subscribers. If you are a premium subscriber please Click Here to log in. If  you would be interested in becoming a subscriber and gaining access to the most accurate forecasting service available anywhere, a forecasting service that gives you exact turning points in both price and time, please Click Here to learn more.Don’t forget, we have a risk free 14-day trial). 

Hence, I suggest the following positioning over the next few days/weeks to minimize the risk while positioning yourself for a forecasted market action.

If No Position: XXXX

If Long: XXXX

If Short: XXXX

Please Note: XXXX is available to our premium subscribers in our + Subscriber SectionIt’s FREE to start. 

Did you enjoy this article? If so, please share our blog with your friends as we try to get traction. Gratitude!!!

Who Is Killing The JP Morgan Bankers? Plus, Market Update Google

CNBC To American People. STFU Already. The US Economy Is On Fire. Plus, Market Update.


Apparently the perpetually bullish machine….aka…CNBC is tired of people doubting this “Amazing American Economic Recovery” over the last few years (please see the article above).  That’s right. How dare are those unemployed, underemployed and out of labor pool fools (about 15% of workforce) doubt the American machine of prosperity. How dare are those drunk college kids with $1.08 Trillion debt burden question the validity of their education. How dare does anyone question this real estate recovery.  After all, there is a billion of Chinese millionaires out there buying every house that they can in the deserts of Nevada and California.

Of course, we know better than that. This so called “American Economic Recovery” is an illusion at best. An illusion driven by debt, credit and speculation.   An illusion were only a select few with direct access to free credit were able to benefit from the economic recovery over the last couple of years.  You know, the exact same folks who are trying to tell us that the economy is doing great. Unfortunately, the rest of us were not so lucky.  

Now, a lot of people are starting to concentrate on class warfare.  Yet, we must understand that it is not the class issue, but rather, an economic issue that will impact us all.  No economy can function, grow and excel to the best of its ability if 90-95% of the population is left behind. I am not sure why it is so hard for CNBC, our administration and the FED to understand that.  Now, with my bitching done….

MARKET UPDATE:

2/18/2014 – An interesting day with the Dow Jones remaining relatively flat by losing only -23 points (-0.14%) while the Nasdaq surged higher with a sizable gain of +29 points (0.68%).

One thing we have to keep in mind is that our timing work is based on the Dow. As of right today, our forecast/trading plan presented on Saturday remains in force and in play. I continue to believe that our forecasted turning point will appear as expected. As such, our previously discussed positioning, outlined on Saturday, should remain in place. 

Further, at least structurally the Dow is confirming our turning point. What I am seeing on Nasdaq somewhat confirms the thesis. I am seeing the most speculative issues appreciate in a vertical fashion, including large gaps and everything else. If this doesn’t feel like a blow off top, at least on the Nasdaq, I don’t know what does.  

In summary, my work continues to show that we are close to a short-term turning point scheduled on XXXX. With that in mind, we just have to wait for the market to do its work over the next few XXXX

CONCLUSION & POSITIONING:

 (*** Please Note: About 75% of the information contained within this section has been deliberately removed. Particularly, exact dates and prices of the upcoming turning points. As well as trading forecasts associated with them. I deem such information to be too valuable to be released onto the general public.  As such, this information is only available to my premium subscribers. If you are a premium subscriber please Click Here to log in. If  you would be interested in becoming a subscriber and gaining access to the most accurate forecasting service available anywhere, a forecasting service that gives you exact turning points in both price and time, please Click Here to learn more. Don’t forget, we have a risk free 14-day trial).

As mentioned in my earlier forecasts, we are looking at February XXXX as a major turning point.To be exact, this particular turning point is located at…

Date: XXXX
Price: XXXX

Hence, I suggest the following positioning over the next few days/weeks to minimize the risk while positioning yourself for a forecasted market action.

If You Are A Trader: On February XXXX, we will be looking for a confirmation that the market has hit its turning point (as per above) and has reversed itself……on an hourly chart. Once such confirmation occurs, I would liquidate our……….

If No Position: XXXX

If Long: XXXX

If Short:  XXXX

END OF UPDATE: —-Please Note: XXXX is available to our premium subscribers in our + Subscriber Section. It’s FREE to start. 

—————————————————————————————————————–

CNBC Idiots

CNBC Writes: Stop whining! The US economy is in good shape

Based on current growth dynamics, this year promises an even better outlook for employment creation and America’s contribution to the world economy.

The most recent evidence from survey data indicates that the U.S. service sector (approximately 90 percent of the economy) continues to expand in a steady and sustained fashion. Despite recent distortions caused by bad weather, the same is true of the manufacturing industries, where the capacity utilization rate is approaching its long-term average of 80 percent.

The U.S. economy is underpinned by growing real incomes, increasing employment, record-low borrowing costs and an easing access to credit facilities as banks continue to open up their channels of consumer financing.

Did you enjoy this article? If so, please share our blog with your friends as we try to get traction. Gratitude!!!

CNBC To American People. STFU Already. The US Economy Is On Fire. Plus, Market Update. Google

Weekly Update & Market Forecast. Very Important Update

daily chart Feb 14, 2014

Weekly Update &Summary: February 15th, 2014

Markets continued to rally throughout the week with the Dow Jones appreciating 360 points (+2.28%) and the Nasdaq gaining 118 points (+2.86%). Structurally, the market did very well, closing all the gaps during the span of the week.  There was a gap left around 15,500 on the Dow, but it will be closed during the subsequent bear market leg.   

Most of the bears who were incredibly excited just two weeks ago are now throwing their hands in the air, in complete disbelief, proclaiming something to the tune of “f$&# this s*&#”. Blaming the FED, market manipulation and everything else under the sun for this unprecedented and powerful two week market rally.  Of course, exactly at the wrong time.

Listen, even though the Nasdaq has set a new all time high, the Dow remains over 400 points below its December 31st, 2013 top.  Plus, we have to take into the consideration the fact that the technical trend is still incredibly bullish. Showing no sign that the bear market has started……as per our claim.

So, what is going on?

Based on my mathematical work, the market is performing just as it should. As I always say, it’s the markets job to confuse, frustrate and destroy as many investors as possible. And that’s exactly what it is doing.  

In my original forecasts in 2013 I have suggested that March of 2014 will be the top of the bull market. That was until I came across a missing piece of data suggesting that December 31st of 2013 was indeed the top. Meaning, as of right now the market continues to trace out the necessary pattern towards its ultimate price and time targets in March of 2014. Yes, a XXXX. 

There is another important point to consider. While it is fairly easy to predict the market over an extended period of time (Ex: 2017 bottom of the bear market) it becomes increasingly difficult to do as the time frame compresses from annual, to monthly, to daily, to hourly, etc…. That has to do with a number of data points an analyst has to consider while working with smaller time frames. Simply put, the amount of available mathematical and cyclical data multiplies exponentially as one begins to narrow down the time frame.

What does that mean? It means that it becomes increasingly complex to predict the market over the short time frames. Not impossible, just more difficult.

Which brings us today’s market environment. We have a number of very important points of force coming up over the next few weeks (described below). Points of force that, at least based on my analysis, clearly outline the market structure over the next few weeks and months. If we are to execute our trading strategy properly, we should be able to walk away with significant gains. All while most other market participants are left behind to scratch their heads in outer confusion. As always.   

Please find the points of force (turning points) and the trading strategy associated with it in the Mathematical & Timing Analysis Section below.  

Fundamental Analysis: 

There has been no change in the fundamental picture. As you know, my fundamental case remains fairly straight forward and clear cut. All stocks and most other markets (credit and real estate) are substantially overvalued due to a massive infusion of credit by the FED over the last few years and pure speculation. How overvalued are we?  

1929-2014-Scary-Chart-021414

Well, during the week there has been a lot of hoopla made about the chart above. Comparing today’s market pattern to the one right before the 1929 stock market crash. Claiming that today’s market is tracing out the same patter, right before the crash.

Certainly, if we look at the chart from the fundamental point of view we can argue that the market is indeed incredibly overpriced and is set for a huge, maybe a  90% huge drop.

Let me just say that the collapse is not going to happen. At least based on my mathematical work. First, comparing patterns between today’s market and the market in 1929 is like comparing oranges to tractors. It is meaningless. One must understand where we are in cyclical composition of the market. And we are nowhere near 1929. If you have to compare, 1912, 1946 and 1981 would be much better options.

Second, simply because the market is overpriced, it doesn’t mean that it is about to collapse 90%. It doesn’t work that way. Remember the market has an internal structure. It is exact and perfect. It always does what it is supposed to do by tracing out its points of force. Any move outside of such points would be equivalent to Earth suddenly jumping into Saturn’s orbit for no apparent reason at all.

The lesson for this week is as follows…..

Even though the market is incredibly overpriced (as per my discussion last week) and even though some patterns “look” similar to the ones leading into the 1929 crash, it doesn’t mean anything. Particularly when it comes to making money through investing and/or trading.  

Macroeconomic Analysis: 

There is so much to report here that I am beginning to think that the entire world is going to hell in a hand basket. From Nikkei shifting into downtrend again, to Spain and Turkey deciding to jointly build an aircraft carrier. Because you know, having hyperinflation, collapsing currency, economic depression and 25% unemployment between both countries is not enough. I am just curious to find out who will control any such aircraft carrier. Perhaps it will be Turkey from Monday to Thursday and Spain from Thursday to Sunday. God forbid if they decide to go into war against each other. My brain is starting to hurt just thinking about this stupidity.  

Then you have a slow down in Germany and EU bureaucrats discussing numerous scams of how they can raise enough capital to sustain the EU. Including a plan to outright confiscate/control savings of EU citizens. No, I am not kidding you. Of course, most of it (if not all of it) is the direct result of an insane monetary policy our leaders have put into action over the last two decades. The idea that we can somehow print our way to prosperity. It only works, until it doesn’t.

Technical Analysis: 

While the overall technical picture continues to remain murky, the resolution should be just around the corner.

Long-Term: The trend is still up. Market action in January-February could be viewed as a simple correction in an ongoing bull market. 

Short-Term: The short term picture shifted from negative to positive. Giving us a technical indication that both the short term and the long term trends are up. Yet, that in itself can be misleading as per our timing analysis discussion below.

Mathematical & Timing Analysis: 

(*** Please Note: About 75% of the information contained within this section has been deliberately removed. Particularly, exact dates and prices of the upcoming turning points. As well as trading forecasts associated with them. I deem such information to be too valuable to be released onto the general public.  As such, this information is only available to my premium subscribers. If you are a premium subscriber please Click Here to log in. If  you would be interested in becoming a subscriber and gaining access to the most accurate forecasting service available anywhere, a forecasting service that gives you exact turning points in both price and time, please Click Here to learn more. Don’t forget, we have a risk free 14-day trial). 

As mentioned in my earlier forecasts, we are looking at February XXXX as a major turning point.To be exact, this particular turning point is located at…

Date: XXXX
Price: XXXX

Hence, I suggest the following positioning over the next few days/weeks to minimize the risk while positioning yourself for a forecasted market action.

If You Are A Trader: On February XXXX, we will be looking for a confirmation that the market has hit its turning point (as per above) and has reversed itself……on an hourly chart. Once such confirmation occurs, I would liquidate our……….

If No Position: XXXX

If Long: XXXX

If Short:  XXXX

CONCLUSION: 

We have an existing couple of weeks coming up. A few major turning points and a number of significant moves. Those anticipating the moves and those who can time them properly will be rewarded appropriately. Once the moves described above play out in full, the market will be set free to continue its next cyclical bear market leg. 

Please Note: XXXX is available to our premium subscribers in our + Subscriber Section. It’s FREE to start. 

Did you enjoy this article? If so, please share our blog with your friends as we try to get traction. Gratitude!!!

Weekly Update & Market Forecast. Very Important Update  Google

Why The Market Top Is In and What You Should Do Next – Update

Long Term Dow Structure35

Update: 

The blog post below was published in January, warning readers that the bull market has topped out on December 31st, ushering in the next leg of the bear market. The bear market that will take us into the 2017 cyclical bear market bottom. Thus far, the market has performed just as anticipated. A substantial decline and a bounce.

However, with the Nasdaq hitting an all time high today, the question is…..is my forecast wrong?

No. Here is why. What you have to understand is that every single market and stock will have its own internal mathematical structure and it’s own rate of vibration. My mathematical work follows the Dow Jones in particular. As such, the market structure remains intact and just as we have been forecasting within our member section. In fact, an important turning point is coming up shortly, pushing and pulling the Dow towards the completion of secondary top in March of 2014. Something I have talked about on this blog a number of times.

Exactly when, where and what steps will the Dow take to get there? I highly encourage you to visit this site tomorrow in order to read our weekly update. I will answer most, if not all, of the questions.  

End Of Update…..

In my earlier blog posts I have mentioned that we had a cluster of very important turning points showing up around December 31st, 2013 and January 1st of 2014 (based on my cycle work). Indicating a significant turning point. 

Yet, my mathematical work at the time didn’t confirm. That is until Tuesday of this week. You can blame a simple brain fart or a lack of sleep on my part.  

I have shown the chart above before. To prove to you that the stock market is not random, but quite the opposite, it is exact. Showing you that there was only a 22 point variance over a 16 year period of time. Further, when we take the values on the chart above and do a few simple calculations we get a value of 12,935.

So what? 

Based on my calculations, the move between March 2009 bottom to December 31st, 2013 top on the DOW was exactly 12,836. That is an exact hit with 0.7% variance. With cycle work and mathematical confirmations coming together, I have no choice but to call for a market TOP.  

(***What calculation? You can learn more about it in my book “Timed Value” by getting two free chapters on timing HERE,  purchasing it on Amazon HERE or getting it as a free bonus HERE). 

Now, even though the market top is in, we have to wait for a technical confirmation before taking our short position. Based on my previous experience that is a prudent thing to do. 

What should you do next?

Option #1: If you are in stocks, start getting out and going into cash. Earning 2-5% annually is heck of a lot better than losing 30-40% over the next 3 years (the length of upcoming bear market). Plus, you will have money when the bottom comes to buy some wonderful companies at give away prices. 

Option #2: Profit on the short side. At the same, this will be a very difficult thing to do. The upcoming bear market is unlikely to be directional. My work shows that it will closely resemble the 2000-2003 bear market with a lot of ups and downs. As such, it will be difficult to make money on the short side.

The best advice I can give you is this. Protect and accumulate cash. Once we hit bottom in 2017, the market will start its 18 year bull market.  

Did you enjoy this article? If so, please share our blog with your friends as we try to get traction. Gratitude!!! 

Why The Market Top Is In and What You Should Do Next – Update  Google

Is The Party Back On? The Stock Market Update

daily chart Feb 13, 2014

***The Market Is About To Turn. What Position Should You Take or Maintain To Maximize Your Gains While Minimizing Risk? Please Click Here To Find Out. 

An interesting day with the Dow Jones up +64 points (0.40%) and the Nasdaq up +39 points (0.94%).

The day started with about a 100 point gap down due to bad retail data. The market rallied right away to close the gap and push further to the tune of +60 points. Turning today’s seemingly regular day into a 150 point rally for the Dow.

As of right now, both the short-term and the long-term chart look exceedingly bullish.  Even though we are properly positioned, extreme caution here is a must.

It seems like the scenario discussed in yesterdays update is in play. While the Dow pushed higher it was unable to break above 16,050 for the time being.  Indicating that the highest range of this bounce leg has been reached and that the market rally is likely near exhaustion.  Whether or not we will see follow through tomorrow, is for the most part irrelevant.  Remember, time is the most important element.  

This works well with our February XXXX day provided in yesterday’s forecast. Making our next update incredibly important. Based on the market actions tomorrow I should have both price and time targets for the top on February XXXX. 

Again, February XXXX should prove to be a turning point of this ………(Would you like to see the exact points of force in both price and time? Plus, what you should do. Please Click Here to +Subscribe to our premium service above. It’s FREE). 

CONCLUSION & POSITIONING:

While the scenario above is highly probable, we must implement proper trading positioning, in case it is not.  Positioning below is as per DOW Jones (not to be applied to individual stocks).

If No Position: XXXX

If Long: XXXX

If Short:  XXXX 

Please Note: XXXX is available to our premium subscribers in our + Subscriber Section. It’s FREE to start. 

Did you enjoy this article? If so, please share our blog with your friends as we try to get traction. Gratitude!!!

Is The Party Back On? The Stock Market Update  Google