InvestWithAlex.com 

Why The FED Will Raise Rates Before The Next Round Of QE

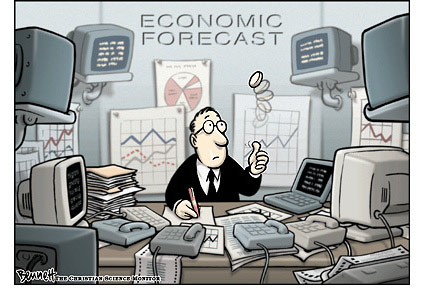
economic_forecasting

Societe Generale’s notorious bear, Albert Edwards, thinks the US Economy is about to implode and the FED will flood the market with another round of QE. More Fed Stimulus Coming in Inflationary Push

The first quarter U.S. GDP data was a major disappointment to the market as business investment declined due to the intensifying U.S. profits recession. Only the biggest inventory build in history stopped the economy subsiding into a recessionary quagmire. Sales are declining on a year-over-year basis, but we are assured this is due to the cold weather. But if it is not, and sales do not surge in coming months, then the economy is heading into recession. GDP would have fallen 2.5 percent since December without inventory growth”, Edwards said.

I couldn’t agree more. So much so that I continue to maintain that we are in a stealth recessionary mode. Meaning, take away zero interest rates, QE and asset speculation, and you will find the US Economy in a full blown recession.

I would also agree that the FED will flood the market with another round of QE and cut interest rates (after they raise it). With that in mind, it is all about timing at this stage. Before they can do any of the above three things must happen. 1. They must raise interest rates. 2. The stock market must decline and 3. The US Economy must slip into an official recession. For now, they reload.

Z31

Why The FED Will Raise Rates Before The Next Round Of QE Google

Capital Outflows And How Fast They Will Collapse The Market.

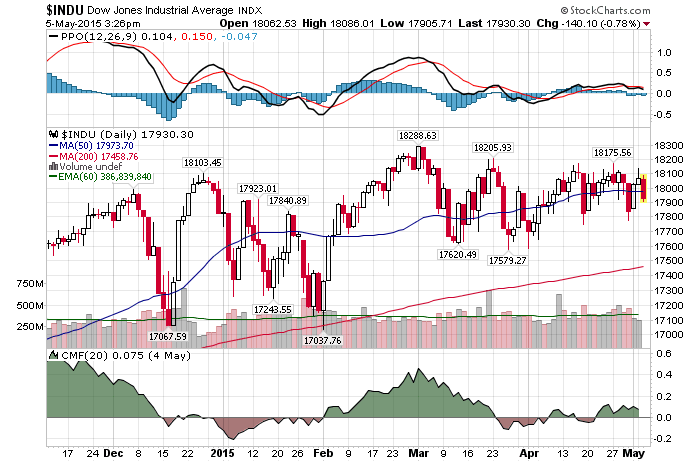
Daily Chart May 5th InvestWithAlex

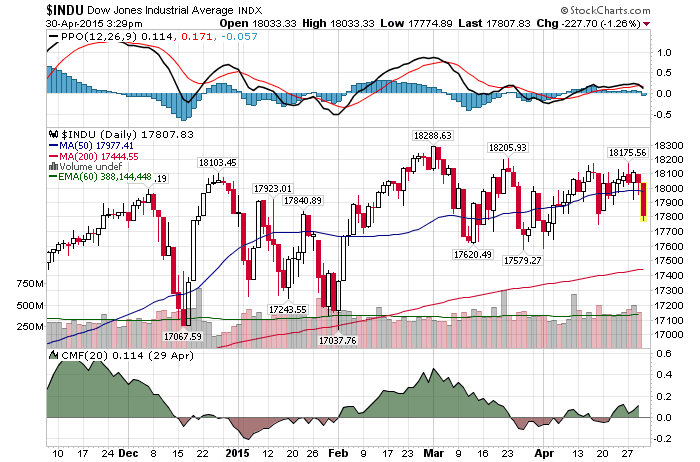
5/5/2015 – A down day with the Dow Jones down 142 points (-0.79%) and the Nasdaq down 78 points (-1.55%)

Despite bullish spirits running high, the stock market has been stuck in a flat trading range for over 10 months now (NYSE). And while most stock prices are miraculously maintaining their upper range, fund outflows are starting to match 2008 panic levels.

In April, U.S. equity mutual funds and ETFs saw outflows of $35.8 billion, according to TrimTabs. That’s the biggest move away from American stocks since October 2008. And the bearish tone is confirmed by the flows in the leveraged ETF space, where leveraged short ETFs saw an increase in assets of 4.6 percent, while leveraged long ETFs saw assets dip by 2.5 percent.

But Wait, There’s More! There is always a bull lurking around, ready to put a positive spin on the news above.

“I actually think it could be a positive for U.S. stocks, because the more people are fleeing equities, the less likely we are to have a crash instantaneously,” Boris Schlossberg of BK Asset Management.  “It’s only when we have bubble-kind-of-conditions that leads to very sharp corrections in equities.”

If my mathematical and timing work is correct, the final leg of a secular 2000-2017 bear market is just around the corner. The only remaining question is, how fast will any such bear leg develop…….will it be a crash or a prolonged decline?

Both. If my work is accurate we should see a fairly rapid sell-off when the TIME is right. Considering today’s market setup and the overall bullish overtone, it will catch most investors by surprise. That will be followed by a quick bounce and a subsequent prolonged decline into the final bottom. In other words, those without this timing and mathematical breakdown stand zero chance of NOT losing money over the next few years.

This conclusion is further supported by my mathematical and timing work. It clearly shows a severe bear market between 2015-2017. In fact, when it starts it will very quickly retrace most of the gains accrued over the last few years.  If you would be interested in learning when the bear market of 2014/15-2017 will start (to the day) and its internal composition, please CLICK HERE.

(***Please Note: A bear market might have started already, I am simply not disclosing this information. Due to my obligations to my Subscribers I am unable to provide you with more exact forecasts. In fact, I am being “Wishy Washy” at best with my FREE daily updates here. If you would be interested in exact forecasts, dates, times and precise daily coverage, please Click Here). Daily Stock Market Update. May 4th, 2015  InvestWithAlex.com

Did you enjoy this article? If so, please share our blog with your friends as we try to get traction. Gratitude!!!

Capital Outflows And How Fast They Will Collapse The Market. Google

Bet Against The FED: The Only Way To Generate Returns Moving Forward

Stan Druckenmiller made over $1 Billion by betting against the bank of England with George Soros in the early 1990’s. In other words, when he talks, you better pay attention. And what does he have to say today? The exact same thing I have been yapping on this blog for quite a while now.

I know it’s so tempting to go ahead and make investments and it looks good for today,” the retired founder of Duquense Capital Management said, “but when this thing ends, because we’ve had speculation, we’ve had money building up four to six years in terms of a risk pattern, I think it could end very badly.

There is nothing more deflationary than creating a phony asset bubble, having a bunch of investors plow into it and then having it pop.

I feel more like it was in ’04 when every bone in my body said this is a bad risk/reward, but I can’t figure out how it’s going to end. I just know it’s going to end badly, and a year and a half later we figure out it was housing and subprime. I feel the same way now.

When you have zero money for so long, the marginal benefits you get through consumption greatly diminish, but there’s one thing that doesn’t diminish, which is unintended consequences.

When this thing ends, because we’ve had speculation, we’ve had money building up for four to six years, in terms of a risk pattern, I think it could end very badly.

Then again, feel free to listen to your Charles Schwab financial adviser and go long on margin. 

Z30

Bet Against The FED: The Only Way To Generate Returns Moving Forward Google

Just A Quick Technical Stock Market Summary

A fairly good technical summary of where the market is today. Of course, the conclusion is bullish, but you shouldn’t expect anything else from the mainstream financial media. By the way, the apparent breakout the guy mentions can be interpreted in a bearish way. As a head fake. In either case, this video is worth 1 minutes of your time.

z33

Just A Quick Technical Stock Market Summary Google

Bubble Or Not: The Clash Of Hedge Fund Egos

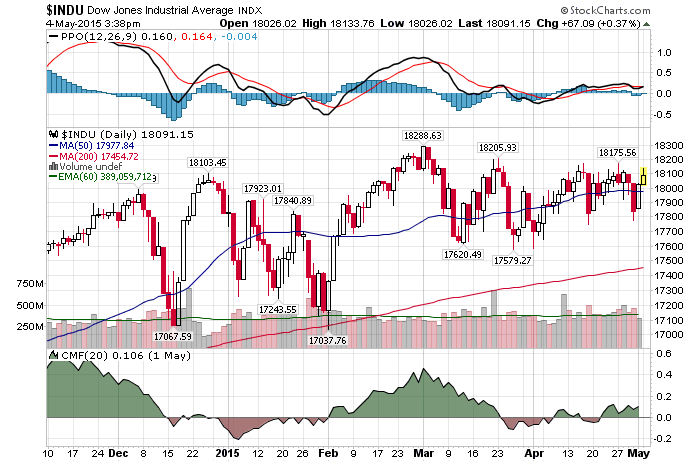
Daily Chart May 4st

5/4/2015 – A positive day with the Dow Jones up 46 points (0.26%) and the Nasdaq up 11 points (+0.23%). 

The overall US Equities market continues to trade within a tight trading range. Arguably, since July 17th of 2014.  And while most investors remain ovewhelmingly bullish, quite a few mega investors are sounding an alarm bell. Who is right? Let take a closer look

Bullish Case: Third Point’s Dan Loeb

We remain constructive on the US for three reasons: 1) economic data should improve in the next few quarters; 2) the Fed does not seem to be in any rush to move early and a June rate hike seems unlikely; and 3) while investors are focused solely on the first rate raise, we think the overall path higher will be gradual, in contrast to previous rate shifts. These factors should create an environment where growth improves and monetary policy stays flexible, which is generally good for equities (higher multiples notwithstanding). We may follow last year’s playbook and ignore the old adage to “sell in May and go away.

This is probably one of the better bullish cases that I have seen in quite a long time. Simply put, it makes sense.

Bearish Case: Carl Icahn (Icahn: Junk bonds now ‘even more dangerous’ than stock market)

Money keeps pouring into high-yield bond funds, even though that market is “ridiculously high,” Icahn said. “When they start coming down, there is going to be a great run to the exits,” he added. High-yield is the best performer in U.S. fixed-income returns in the year so far. The billionaire activist investor said he’s “very concerned” about the stock market, and he’s hedged in preparation for a correction. Below are a few other nuggets from his appearance on the show.

That is fairly self-explanatory. So, who is right? 

I would have to side with Mr. Icahn, but not for the reasons you might think. When we look at the fundamental variables described above (the FED, interest rates, liquidity, earnings, P/E, growth, etc….), they do not really matter. Don’t get me wrong, they do matter, but not when it comes to timing major turns in the stock market.

As my book Timed Value shows, the market traces out an exact mathematical structure as it moves in 4-Dimensional (or higher) space. What does that mean? It simply means that the market will turn around and initiate its sell-off when the TIME & PRICE are right. Not when fundamental data turns.  That is to say, my data is not showing anything positive.

This conclusion is further supported by my mathematical and timing work. It clearly shows a severe bear market between 2015-2017. In fact, when it starts it will very quickly retrace most of the gains accrued over the last few years.  If you would be interested in learning when the bear market of 2014/15-2017 will start (to the day) and its internal composition, please CLICK HERE.

(***Please Note: A bear market might have started already, I am simply not disclosing this information. Due to my obligations to my Subscribers I am unable to provide you with more exact forecasts. In fact, I am being “Wishy Washy” at best with my FREE daily updates here. If you would be interested in exact forecasts, dates, times and precise daily coverage, please Click Here). Daily Stock Market Update. May 4th, 2015  InvestWithAlex.com

Did you enjoy this article? If so, please share our blog with your friends as we try to get traction. Gratitude!!!

Bubble Or Not: The Clash Of The Hedge Fund Egos Google

Has Warren Buffett Lost His “Value” Mind?

warren-buffett-investwithalex

Well, there you have it. Warren Buffett believes the stock market is inexpensive at today’s valuation levels. Straight from the horse’s mouth.

“If these interest rates were to continue for 10 years, stocks would be extremely cheap now,” the chairman and CEO of Berkshire Hathaway. If rates normalize, stocks would be on the high side on a valuation basis, he said. “They’ve fooled me so far. So I’ve been wrong,” he said. “I would have thought by now you would have seen much higher rates than we have now, which is essentially nothing.”

Fair enough. Well, if we are to take this one step further and say that interest rates are zero or negative (which they almost are – inflation adjusted), we can then argue that the stock market valuation could be and should be INFINITE.

I would argue that Buffett’s mentors Graham & Dodd would not for a second believe in what Mr. Buffett is trying to preach. Today’s unusually low interest rates should not be used for valuation purposes. Investors should realize that we are at the bottom of a 35 year bear market in yields and that they will head higher as soon as the secondary bottom on a 10-Year Note is set over the next 2 years, at around 1.4-1.5%.

How fast will they surge thereafter? Once the bottom is in, any bull market in yields can be sharp. So much so that I wouldn’t be surprised to see yields at around 6% by 2020. And if that is the case, today’s valuation levels are not only high, they are in a bubble level territory.

z32

Has Warren Buffett Lost His “Value” Mind  Google

Shocking: Long-Term Stock Market Composition Predicts A Severe Bear Market

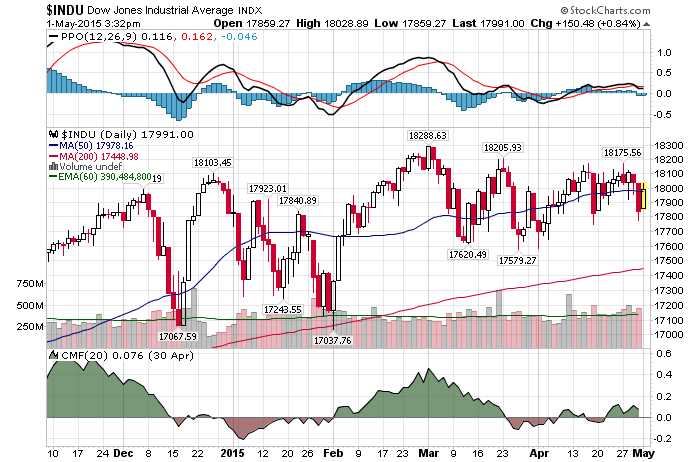
Daily Chart May 1st5/1/2015 – A positive day with the Dow Jones up 182 points (+1.02%) and the Nasdaq up 64 points (+1.29%) 

Below is a comprehensive longer-term review of the stock market and what the next few years hold. 

In the early January of 2000, the US Economy wa s booming. The Dow was fast approaching 11,800 and the Nasdaq was a stone throws away from its improbable benchmark of 5,000. Everyone was making a ton of money and as far as most people were concerned, the future looked very bright.  So much so, that very few people predicted a bear market of 2000-2002, let alone a secular 2000-2017 bear market that was about to begin.

The only way to do so was to know and to understand the cyclical TIME structure oscillating within the stock market.  For instance, an analyst working with such time cycles would know that the stock market’s 17-18 year cycle was topping out in conjunction with the 5 year cycle that started at 1994 bottom.  The bull market that started at the bottom in August of 1982 was coming to a conclusion. In fact, it would top out exactly 17.5 years after it had started or on January 14th, 2000 at 11,800. The 5 year cycle that started in December of 1994 would top out at exactly the same time; 5 years and 35 trading days after it had started.

What does this have to do with predicting a severe bear market of 2014/15-2017?

Everything.  Based on my work the stock market is a mathematically precise entity. And while there are hundreds of TIME cycles oscillating within the stock market at any one time, I will concentrate on only two to prove my point.  The 17-18 cycle and the 5 year cycles. We will look at these cycles over the last 100+ years and I will prove to you, without a shadow of a doubt, they work.

THE 17-18 YEAR CYCLE IN THE STOCK MARKET:
Long Term Dow Structure3

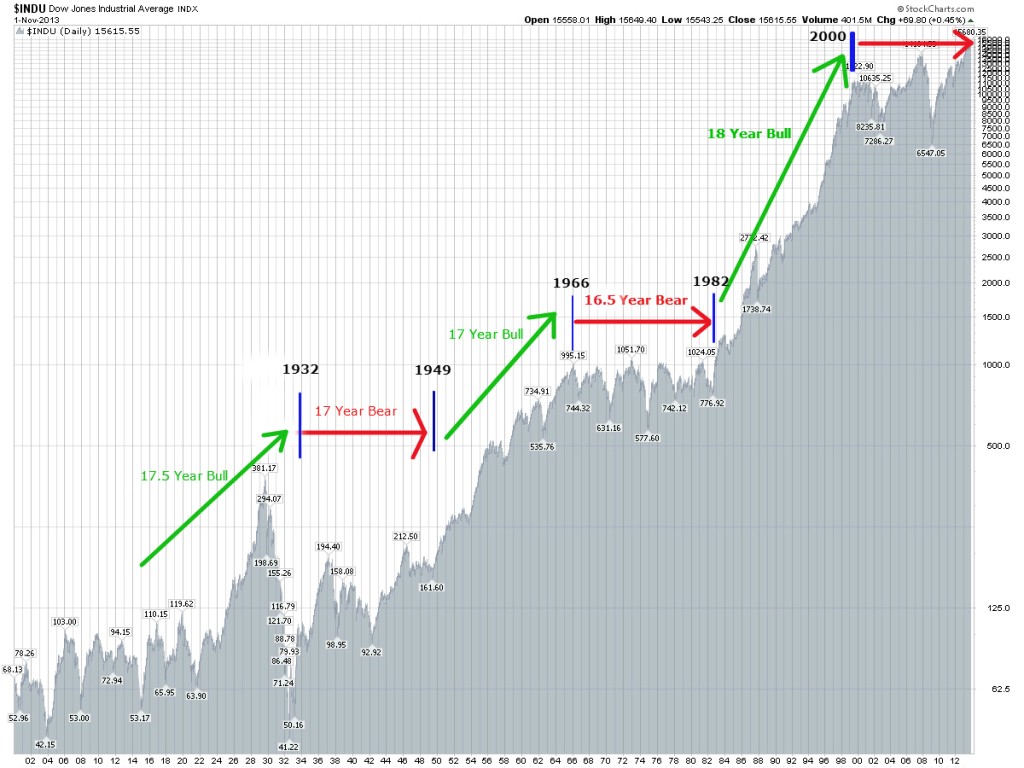
Long-term cycles within the stock market tend to oscillate going all the way back to the first day of trading, in May of 1790.  If you would be inclined, I would encourage you to verify that information for yourself. For our purposes we will start our analysis a little bit later or exactly 100 years ago. As the chart above indicates, the stock market tends to oscillate in clearly defined 17-18 year alternating Bull/Bear market cycles.

  • 17.5 Year Bull Market (1914 bottom to 1932 bottom): The previous bear market terminated in July of 1914. At that time the US stock market shut down for World War 1. The stock market remained closed between August of 1914 and December of 1914 (a very rare occurrence). When the market finally reopened in December of 1914 it immediately began a rally that would not terminate until October of 1929. Followed by a now famous 1929 stock market crash and a massive 90% 3 year decline. The cycle terminated at the bottom in 1932, completing the 17.5 year bull market cycle at that time.

*Note: It is important to address the 1929-1932 bear market and its impact on the overall 1914-1932 Bull Market cycle. It is a complex matter to discuss without sufficient background or understanding, but the final (short-term) structural composition of this Bull Cycle inverted over the last 3 years (1929-1932). Mostly due to a massive rally between 1924-1929 and a number of down cycles converging on this time period at the same time.  Regardless, the overall cycle lasted 17.5 years.

  • 17 Year BEAR Market (1932 bottom to 1949 bottom): The cycle originated at the bottom in July of 1932 and lasted until June of 1949. During this period of time we had a post great depression bounce, 1937 crash and World War 2. Yet, despite the overall upward trajectory, this clearly defined 1949 bottom remained 60% below its 1929 top and well below both its 1937 and 1942 tops.
  • 17 Year BULL Market (1949 bottom to 1966 top): The market surged higher between 1949 bottom and 1966 top. This was the so called “Golden Age” of post war reconstruction and the American industrial boom. During this time the Dow appreciated over 500% in a clearly defined bull market cycle.
  • 16.5 Year BEAR Market (1966 top to 1982 bottom): The market stayed relatively flat during this period of time with a few notable declines of 30-50%. With the 1972-1974 mid cycle decline of 54% being the largest one.  This clearly defined bear market completed in August of 1982. Approximately 25% below its 1966 top.
  • 17.5 Year BULL Market (1982 bottom to 2000 top): A very well known period and a clearly defined bull market. The market surged higher from its August of 1982 bottom to reach its historic top in January of 2000. During this time the Dow appreciated over 1,400% in one of the strongest bull markets in history.
  • 17 Year BEAR Market (2000 top to 2017 bottom): Even though the market is sitting near all time highs (as of this writing in January of 2014) and even though most people have assumed that the new bull market has started, in relative terms the market hasn’t appreciated very much since its top in 2000. The Nasdaq is still down. Plus, with the final down leg of this bear market being ahead of us (based on my mathematical and timing work), the BEAR market of 2000-2017 should complete itself in a negative territory or below its 2000 top.

It is important to note that the small variation (of +/- 1 year) in duration of these cycles is caused by smaller or larger cycles arriving at the same time. As such and based on the cycles above, we are no longer working in an arbitrary fashion when it comes to predicting the stock market.  In other words, if the stock market repeats a clearly defined 17-18 year Bull/Bear cycle over a 220 year period of time (since 1790) and does so without interruption,  it is safe to assume that the future is predictable and not random.

THE 5 YEAR CYCLE IN THE STOCK MARKET

One other easily identifiable cycle within the stock market is the 5 year cycle. These 5 year cycles represent one completed growth pattern or one completed Bull or Bear cycle. Typically, they tend to appear for 5 years, disappear and then reappear at a certain point in the future. While they are not sequential as the 17-18 year cycle above, once their place within the overall stock market is understood, they show up at exactly the right time.  For instance,

  • 1914 -1920: Bull Market
  • 1924-1929: Bull Market (followed by a 1929 crash)
  • 1932-1937: Bull Market (followed by a 1937 crash)
  • 1937-1942: Bear Market
  • 1966-1971: Bear Market
  • 1982-1987: Bull Market (followed by a 1987 crash)
  • 1994-2000: Bull Market (followed by a 2000 crash)
  • 2002-2007: Bull Market (followed by a 2007 crash)
  • 2009-2014: Bull Market

One thing to understand about these 5 Year cycles is that they are exact. They have much lower level variance as compared to their longer counterparts. Essentially, we are NOT talking about 5 years +/- 6 months. We are talking about 5 years +/- a few days. For instance, the 2002-2007cycle started on October 10th, 2002 (at 2002 bottom) and terminated on October 11th, 2007. If you are counting, that is exactly 5 Years and 1 day or scary accurate. I encourage you to study the other cycles outlined above in order to prove to yourself how shockingly accurate they all are.

 CONCLUSION: 

In summary, predicting a bear market of 2015-2017 is rather simple.  All 17-18 year bear cycles end with a 2-3 year bear market. For instance, 1912-1914, 1946-1949 and 1979-1982. And while most believe that the secular bear market ended at 2009 bottom, it is not the case. The secular bear market of 2000-2017 is still in effect and will terminate only when the year 2017 is reached. Although the final price bottom will be higher than the mid-cycle bottom reached in March of 2009.

Further, the 5-Year cycle that started on March 6th, 2009 bottom terminated on July 16th, 2014. Suggesting that the stock market is now ready to initiate its bear leg (despite recent higher highs). When I combine this cyclical analysis with the rest of my mathematical and timing work, the outcome is crystal clear. A severe bear market of 2015-2017 is just around the corner.

This conclusion is further supported by my mathematical and timing work. It clearly shows a severe bear market between 2014/15-2017. In fact, when it starts it will very quickly retrace most of the gains accrued over the last few years.  If you would be interested in learning when the bear market of 2014/15-2017 will start (to the day) and its internal composition, please CLICK HERE.

(***Please NoteA bear market might have started already, I am simply not disclosing this information. Due to my obligations to my Subscribers I am unable to provide you with more exact forecasts. In fact, I am being “Wishy Washy” at best with my FREE daily updates here. If you would be interested in exact forecasts, dates, times and precise daily coverage, please Click Here). Daily Stock Market Update. May 1st, 2015  InvestWithAlex.com

Did you enjoy this article? If so, please share our blog with your friends as we try to get traction. Gratitude!!!

Shocking: Long-Term Stock Market Composition Predicts A Severe Bear Market  Google
Stockman and El-Erian: Get Ready For A Bear Market

z31As yours truly, David Stockman and Mohamed El-Erian continue to warn their followers that a big stock market decline and a severe recession are coming down the pipeline.
David Stockman: 

  • “The worldwide central bank money printing spree of the last two decades has generated massive excess capacity and mal-investment all around the planet.”
  • “What is coming, therefore, is not their father’s inflationary spiral, but an unprecedented and epochal global deflation.”
  • “So the central banks just keep printing, thereby inflating the asset bubbles worldwide. What ultimately stops today’s new style central bank credit cycle, therefore, is bursting financial bubbles. That has already happened twice this century. A third proof of the case looks to be just around the corner.”

Mohamed El-Erian: 

  • Financial markets have grown addicted to central bank easing, and that addiction could cause a heap of trouble when central banks tighten the credit spigot.
  • “It reminds me a little bit of 2007 and 2008,” when investors tried to discern when the turn would come away from easy credit conditions, El-Erian said. “I’m not so confident that I will see the turn coming, and turns tend to happen quite quickly.”

I couldn’t agree more. The only remaining question is…….are the US Equity markets currently going through a 9 month distribution or consolidation period? If distribution, the time to pay the piper may be soon at hand.

Z30

Stockman and El-Erian: Get Ready For A Bear Market Google

Marc Faber Expects A 60-40% Decline. Is He Insane?

Daily Chart April 30 2015

4/30/2015 – A big down day with the Dow Jones down 196 points (-1.09%) and the Nasdaq down 82 points (-1.64%).

The stock market continues to behave as forecasted in our subscriber section. Are we about to bounce to new all time highs -OR- is this sell-off just getting started? Click Here to find out.

Marc Faber has been off of his game over the last few years. So much so that the talking heads within the financial media community now openly laugh at his “Bear Market” forecasts. Now, more bearish than ever, Marc expects a rapid 40-60% decline. Has he gone insane?  Let’s take a look.

“For the last two years, I’ve been thinking that U.S. stocks are due for a correction,” Faber said Wednesday on CNBC’s “ Trading Nation .” “But I always say a bubble is a bubble, and if there’s no correction, the market will go up, and one day it will go down, big time.”

My Comment: Oftentimes the best researched bears are too early to the party. I am guilty of the same…..at least I used to be. I remember shorting sub-prime lenders in early 2006 and then wondering how these clearly bankrupt companies can surge higher. By the summer of 2008 they were worth ZERO.

“The market is in a position where it’s not just going to be a 10 percent correction. Maybe it first goes up a bit further, but when it comes, it will be 30 percent or 40 percent minimum!” Faber asserted.

My Comment: Bingo. Most investors have assumed, wrongfully I might add, that we are in a new secular bull market. As a result, everyone believes that every 10-15% correction will be recovered.  Nothing to worry about – buy the dips. It will be interesting to watch as a 10% correction turns into a 20%, 30%, etc…..

Faber says low yields and stimulative central bank policies around the world have led to a condition in which “all assets are grossly overvalued … and eventually this will unwind and cause some problems. Look at the market since November of last year to now. The market is up 2 percent. It hasn’t done much, and a lot of stocks are breaking down. I don’t think that the market is in a healthy condition.”

My Comment: I have been talking about the same thing for at least a few months now. Even though the stock market hasn’t really gone anywhere for close to 9 months, based on NYSE, bullish animal spirits are as strong as ever. Crazy.
Despite his massively bearish call, Faber said he’s “not short the market yet,” since he doesn’t know how high stocks could go in the interim. Still, he makes clear that “I’m not interested to buy momentum, I’m interested to buy value.”

My Comment: He is absolutely right. Buying now would be a suicide mission. At the same time, Marc is too scared to go short. And not only Marc. Every single bear I know, except yours truly, is scared of this market. Do I smell an opportunity? That’s why it helps to know exactly when the top is due.

In conclusion, NO,  Marc Faber is not insane. In fact, he might be the only sane person in this insane asylum we call the stock market.

This conclusion is further supported by my mathematical and timing work. It clearly shows a severe bear market between 2015-2017. In fact, when it starts it will very quickly retrace most of the gains accrued over the last few years.  If you would be interested in learning when the bear market of 2015-2017 will start (to the day) and its internal composition, please CLICK HERE.

(***Please Note: A bear market might have started already, I am simply not disclosing this information. Due to my obligations to my Subscribers I am unable to provide you with more exact forecasts. In fact, I am being “Wishy Washy” at best with my FREE daily updates here. If you would be interested in exact forecasts, dates, times and precise daily coverage, please Click Here). Daily Stock Market Update. April 10th, 2015  InvestWithAlex.com

Did you enjoy this article? If so, please share our blog with your friends as we try to get traction. Gratitude!!!

Marc Faber Expects A 60-40% Decline. Is He Insane?  Google