InvestWithAlex.com 

Daily Stock Market Update. July 1st, 2014. InvestWithAlex.com

daily chart July 1 2014

A strong up day with the Dow Jones up 129 points (+0.77%) and the Nasdaq up 50 points (+1.14%)

The market continues to behave exactly as per our forecast (member section). Most markets have opened a large gap up in the morning that the market will have to close over the next few trading days/weeks. Plus, with the Dow stopping just 1 point shy of that magical 17,000 number, the chances are high that the bulls will push the market above that level in the near future.

Despite the euphoria, I would, once again, caution you against falling for this bull trap. Let me put it this way. Those who are buying at today’s levels will look back in 2 years time and then proceed to slam their heads against a concrete wall. Questioning, once again, how they could have been so stupid to buy stocks at such dizzying heights.

This conclusion is further supported by my mathematical and timing work. It clearly shows a severe bear market between 2014-2017. In fact, when it starts it will very quickly retrace most of the gains accrued over the last few years.  If you would be interested in learning when the bear market of 2014-2017 will start (to the day) and its internal composition, please CLICK HERE

(***Please Note: Due to my obligations to my Subscribers I am unable to provide you with more exact forecasts. In fact, I am being “Wishy Washy” at best with my FREE daily updates here. If you would be interested in exact forecasts, dates, times and precise daily coverage, please Click Here). Daily Stock Market Update. July 1st, 2014 InvestWithAlex.com

Did you enjoy this article? If so, please share our blog with your friends as we try to get traction. Gratitude!!!

Daily Stock Market Update. July 1st, 2014. InvestWithAlex.com  Google

What’s Driving The Stock Market Higher?

buyback investwithalex2

As you very well know, many have been scratching their heads while trying to figure out what is pushing this highly speculative stock market ever higher. I have already illustrated a number of times that institutions are net sellers and while retail investors are buyers, the overall amount is not nearly enough to push the stock market to all time highs.

So, who is buying? 

In-short, corporate buybacks are the most likely culprit in today’s stocks market rally. The rich get richer as stock buybacks surge.

Repurchases and buybacks soared nearly 60 percent in the first quarter, putting a floor under a market that struggled amid a brutal winter and an economy that contracted at least 1 percent. Companies have used bargain-basement interest rates to borrow money for stock purchases. In all, corporations increased buybacks by 59 percent to $159.3 billion, according to S&P Dow Jones Indices. That’s up strongly from the $100 billion for the same period in 2013 and a bit below the $172 billion high set in the third quarter of 2007, just before the financial crisis and market crash that sent indexes plunging 60 percent.

Nothing new here as corporations continue to act as Individual/Retail investors. AKA…..Stupid Money. What’s worst is that they are borrowing money to speculate in their own stocks on margin. Driving up stock bonuses and corporate payouts for their management teams. Yet, we all know how this story ends. Just take a look at 2007-2009.

Z31

What’s Driving The Stock Market Higher?  Google

Warning: Bullish Sentiment Pushing Extreme Levels.

bulls vs bears investwithalex

I might be beating a dead horse here, but I keep hearing that there are just too many bears out there for this market to fall. While it’s a good investment thesis, the reality is quite different.

According to the Lindsey Group’s Peter Boockvar, bullish sentiment is at levels even higher than they were in December 2013, October 2007 and August 1987, and we all know how that ended. Using data from a survey conducted by Investors Intelligence, Boockvar says the number of bulls exceeds the number of bears by a near record margin. “Bulls are now just .3 [points] from a record high in December ’04 and compares with 61.6 in December ’13, 62.0 in October ’07 and 60.8 in August ’87,” Boockvar wrote in a morning note.

And there you have it. Every single time we have been here before, a huge sell off followed. While these sentiment readings are great at ascertaining where we are in the overall composition of the stock market, they are very poor at predicting timing.

Luckily for you, timing is my specialty.  My mathematical and timing work is very clear in this. It shows a severe bear market between 2014-2017. When it starts it will very quickly retrace most of the gains accrued over the last few years. If you would be interested in learning exactly when the bear market will start (to the day) and its subsequent internal composition, please CLICK HERE

z32

Warning: Bullish Sentiment Pushing Extreme Levels.  Google

Daily Stock Market Update. June 2nd, 2014. InvestWithAlex.com

daily chart June 2 -nasdaq  2014

6/2/2014 – A mixed day with the Dow Jones up 26 points (+0.16%) and the Nasdaq down 5 points (-0.13%)

I haven’t heard anyone else mention this, at least not yet, but it appears that the Nasdaq might be building a fairly large Head-And-Shoulders trading pattern.  With the left shoulder starting on December 12th, 2013, top of the head appearing in early March and the start of the right shoulder developing from the April 11th bottom. Plus, if we take TIME symmetry into consideration, the right shoulder doesn’t have that much more time to complete itself.

What does all of that mean?

Typically, head and shoulder patterns develop and set off major trend shifts. Basically, if the Nasdaq ends up completing this pattern over the next few trading weeks/months and then proceeds to breakdown below 4,000, there will be hell to pay on the downside. As you know from my previous posts, the fundamentals and various other market divergences tend to support this hypothesis.

Not only that, this is further confirmed by my mathematical and timing work. Again, my work shows a severe bear market between 2014-2017. When it starts it will very quickly retrace most of the gains accrued over the last few years. If you would be interested in learning exactly when the bear market will start (to the day) and its subsequent internal composition, please CLICK HERE

(***Please Note: Due to my obligations to my Subscribers I am unable to provide you with more exact forecasts. In fact, I am being “Wishy Washy” at best with my FREE daily updates here. If you would be interested in exact forecasts, dates, times and precise daily coverage, please Click Here). Daily Stock Market Update. June 2nd, 2014 InvestWithAlex.com

Did you enjoy this article? If so, please share our blog with your friends as we try to get traction. Gratitude!!!

Daily Stock Market Update. June 2nd, 2014. InvestWithAlex.com Google

Sell Gold & Buy Stocks: Stupidest Investment Advice Ever?

gold consolidation investwithalex

These bozos think you should Dump gold and buy stocks.

While this advice might not be as bad as to buy stocks on margin in October of 1929,  it is not that far behind. Now, before I go any further allow me to disclose that I am NOT a gold bug, bull, bear or any other label you can stick on someone. I am simply here to make money through the use of advanced mathematical/timing/fundamental/technical work and a risk averse trading approach.

While I do not own gold at the time (the timing is wrong), to tell someone to sell their “undervalued” gold right before its massive and sustained rally in order to speculate in stocks that have long detached from any reasonable valuation reality is…..well….idiotic.

In fact, if there was ever a trade that I would advice against, this would be it. I had a much more detailed article on Gold over last few days and you can check it out for a better overview As Gold Continues To Collapse, What’s Next?  In terms of equity markets, today’s situation is identical to the one at 2000 and 2007 tops and I wouldn’t touch any equity on the long side with a ten foot pole.

What do you think? Would love to see your comments. 

Z30

Crazy: When Even The Bears Expect The Market To Go Up…..Is It Time To Go Short?

S&P Chart 2

I continue to be amazed how very few money managers within the investment industry are willing to turn bearish. Even some of the hard core bears who have been calling for a stock market crash over the last few years have turned bullish. Expecting a “steady 7-8% return” from the S&P. Exactly at the wrong time.

Particularly in today’s extreme speculative overvaluation environment driven by a massive infusion of credit into our financial system. Diluting everything from simple P/E ratios to more complex valuation metrics. Making today a perfect case study of human psyche at market tops (just as in 2000 and 2007). Here is a hint, the mindset is identical.

David Tepper, founder of the $20 billion Appaloosa Management hedge fund, told attendees at the SkyBridge Capital SALT 2014 conference, “I’m not saying go short. I’m just saying don’t be too fricking long right now.” Tepper is putting his money where his mouth is; he has cut his equity exposure to 60 percent, from 100 percent, in the past six months.

WOW. Only 60%? Incredible. While David is not saying “Go Short”, I have no problem with coming out and saying just that. Just remember…. timing, proper trading and risk management techniques become crucial in such an environment.

While I will not divulge exactly when the bear market of 2014-2017 will start in a public forum, you can learn the actual date by clicking HERE.

I will say one thing. Those expecting a steady return of 7-8% are in for quite a shock. 

z33

The Shocking Truth About The “Great Rotation” Within The Stock Market

S&P chart investwithalex

According to market pundits below, a great rotation within the stock market is underway. Out of small caps/growth and into value. There is only one problem with such a view…..

There is no value left. 

And I am being totally serious. I always look for value, but as of today I cannot find any. ZERO. I did find a value/growth/turnaround play two months ago, RiteAid (RAD), but even that stock is up over 30% in a little over one month. Further, the P/E ratio that everyone points to is being highly distorted by a massive amount of credit within our financial system and cannot be relied upon. I have discussed that before.

Listen, there is no rotation. What you are witnessing is a rollover most commonly associated with market tops. Small caps and growth are simply leading the market. In due time, the Dow Jones or perceived value will follow this lead to the downside. It is as simple as that.

This is further confirmed by our mathematical and timing work. Again, our work shows a severe bear market between 2014-2017. When it starts it will very quickly retrace most of the gains accrued over the last few years. If you would be interested in learning exactly when the bear market will start (to the day) and its subsequent internal composition, please CLICK HERE

Did you enjoy this article? If so, please share our blog with your friends as we try to get traction. Gratitude!!!


The Shocking Truth About The “Great Rotation” Within The Stock Market  Google

Talking Numbers: Why there may be nowhere to hide in the market

The S&P 500 may be at record highs but underneath the surface, the Great Rotation of 2014 is underway. And, that could be bad news for stocks ahead.

According to TrimTabs Investor Research, there has been a “massive” rotation out of growth stocks and into value stocks this spring. Since the start of April, growth-oriented exchange-traded funds (ETFs) redeemed $5.6 billion while value-oriented ETFs issued $3.9 billion.

z33

Broken out by size, $4.6 billion were redeemed out of large-cap growth stocks and $2.6 billion were issued in large-cap value stocks. Meanwhile, $750 million were taken out of small-cap growth companies and $150 million were issued in small-cap value ETFs.

Growth % of assets Value % of assets
Large cap -$4.6 billion 4.9% +$2.6 billion 2.5%
Small cap -$750 million 5.9% +150 million 1.0%

Source: TrimTabs Investment Research

 Gina Sanchez, founder of Chantico Global, sees this as a trend that will continue.

“All of the defensive sectors have performed quite well this year,” said Sanchez, a CNBC contributor. “A lot of the highfliers and momentum stocks have just gotten destroyed. That’s going to continue.”

However, Sanchez sees this less of a move into value and more about the markets dumping momentum stocks. That could continue until those momentum stocks have more “realistic ranges” in value, she says. In the meantime, that could hurt the overall market.

“I think this defensiveness is going to continue,” Sanchez said. “We could actually see a correction in the market as a result of that continued concern.”

Richard Ross, global technical strategist at Auerbach Grayson, also thinks a correction is coming.
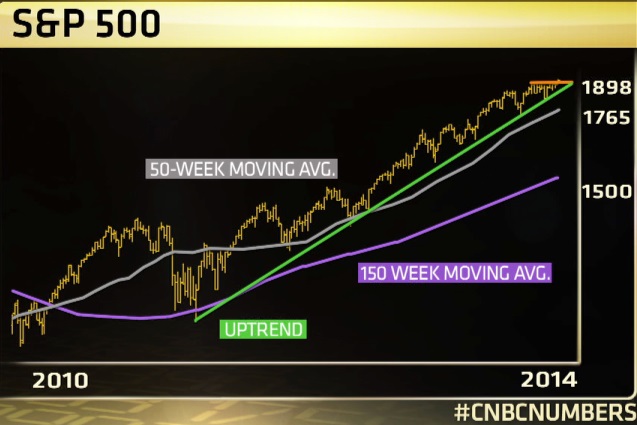
Although Ross’ charts show that the benchmark S&P 500 index has remained above its rising 150-day moving average in a well-defined trend channel since June 2013, it has been unable to break above the 1,900 level..

z33

And, “The longer-term structure remains vulnerable,” Ross said. The S&P 500 may have stayed above its 50-week moving average since 2012 but Ross believes the index is starting to move far from its 150-week moving average, currently around 1,500. That could be a potential target.

“That has to be considered a possibility,” Ross said. “Yes, we can remain above trend and go even longer higher. But, I think that this move to value over growth – to bonds over stocks, if you will –tells you that the market is looking for insurance. It’s scared and, in the end, there will be nowhere to hide.”

Bonds & Stocks Continue To Rally. Who Is Right And Who Will Break Down First.

If you haven’t noticed, both the bond market and the stock market have been rallying as of late. An unusual situation. The real question is……which market has got it right and/or which of these markets will break first?

Will the bond yields begin to rise in tandem with the stock market as the US Economy accelerates growth -OR- will the stock market break down, pulling both the US Economy and the bond market down?

Typically, the bond market is considered to be the “more intelligent” market and I would have to agree with that classification in this particular case. With the US stock market being severely overvalued (in bubble territory) and with the FED tightening in full force, it is just a matter of time before the bond market comes out on top.

This is further confirmed by our mathematical and timing work. Again, our work shows a severe bear market between 2014-2017. When it starts it will very quickly retrace most of the gains accrued over the last few years. If you would be interested in learning exactly when the bear market will start (to the day) and its subsequent internal composition, please CLICK HERE

10 Year Yield

Did you enjoy this article? If so, please share our blog with your friends as we try to get traction. Gratitude!!!

Click here to subscribe to my mailing list


Google

Talking Numbers: How long can stocks and bonds rally together?

Call it the ultimate game of chicken.

The Dow Jones Industrial Average closed at record highs on Friday. The S&P 500 index is just a few points shy of its all-time highs. And yet, year-to-date, as the S&P 500 continues to defy gravity, investors have been furiously buying up bonds as well.

So, which will break first: stocks or bonds?

Portfolio manager Chad Morganlander of Stifel Nicolaus’ Washington Crossing Advisors thinks bonds will crack first.

“I think interest rates are going to start going higher as the economy starts to improve and accelerate into the second quarter,” Morganlander said. “I think the [10-year Note] could go around 2.85 to 2.90 [percent].” Bond prices and rates move inversely to each other.

According to Morganlander, evidence of an accelerating economy will include nonfarm payrolls growing at a rate higher than 300,000 per month (it was 288,000 in April), higher household credit creation, and housing starts at an annual rate of 1.2 million (it was 946,000 in March).

But, while he sees the 10-year yield getting closer to 3 percent, he is optimistic on stocks as well. “We are quite bullish on the market,” Morganlander said. “We think that the equity markets are going to go higher by about 7 to 8 percent for the year.”

Mark Newton, chief technical analyst at Greywolf Execution Partners, doesn’t think rates will necessarily move up just yet.

“It’s still difficult to argue that the 10-year yield has to move straight up from here,” Newton said. “I know in the long run, that’s likely correct but in the short run, we’ve been very range-bound over the last few months.”

That range in the US Treasury 10-year yield is roughly between 2.56 and 2.82 percent, according to Newton. There is “very little sign, at least technically, that rates should move up right away. The chart overall is still quite bearish.”

Newton sees rates and stocks moving together, but this time to the downside.

“I think we’re going to see a move to 2.45 first,” said Newton about the 10-year yield. “That likely coincides with an equity correction probably between the months of July and September. That’s seasonal time when stocks usually pull back and we see that flight to safety in the Treasurys.

On the longer-term charts, Newton sees the 10-year yield moving down a well-defined trend channel since the mid-1980s. The upper end of that trend channel is currently around 3.75 percent.

“We almost need to get up above 3.75 to argue that a bigger move higher in rates is going to happen,” Newton said. “Rates over the long term are likely going to rise and it’s probably a poor risk/reward for investors. But, I think from a trading perspective, money should flow into Treasuries if the market starts to pull back more for safety reasons.”

“Over the next few months,” adds Newton, “I can still see rates pulling back here, getting back under 2.56 and down to 2.45.”

To see the full discussion on the US 10-Year Note, with Morganlander on the fundamentals and Newton on the technicals, watch the above video.