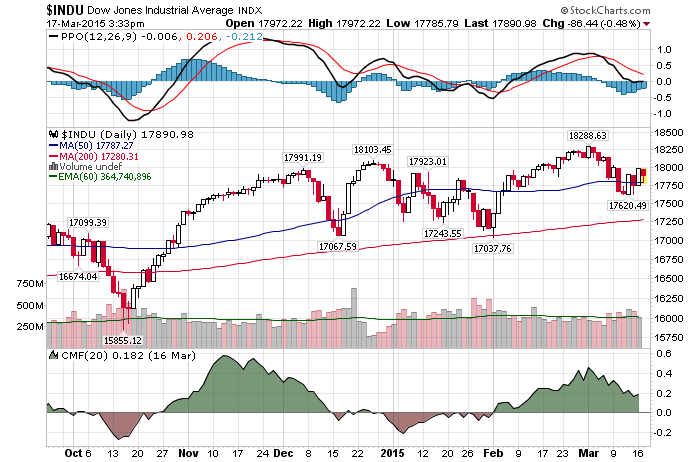
3/17/2015 – A mixed day with the Dow Jones down 129 points (-0.72%) and the Nasdaq up 8 points (+0.16%)
Let’s take a look at some charts in order to come to a very simple conclusion.
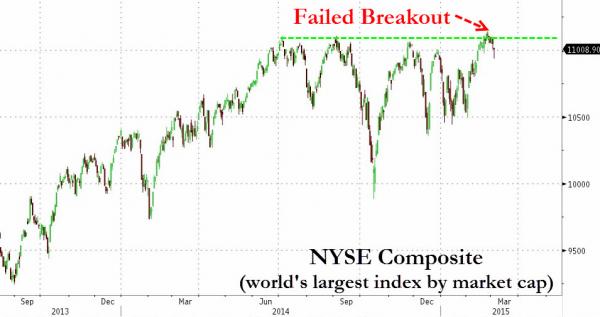
Two weeks ago I talked about the chart below. Suggesting that the majority of the stocks haven’t gone anywhere since about June 16th, 2014. You can see even more evidence of that here A hidden bear market in Dow threatens all stocks

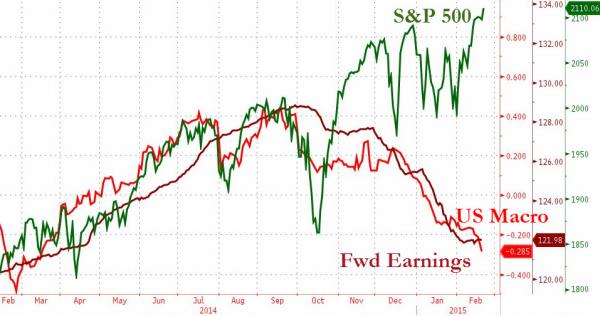
Not only that. Various macroeconomic indicators have collapsed while earnings multiples continue to expand. Plus, corporates are starting to guide lower. That is to say, something has got to give.

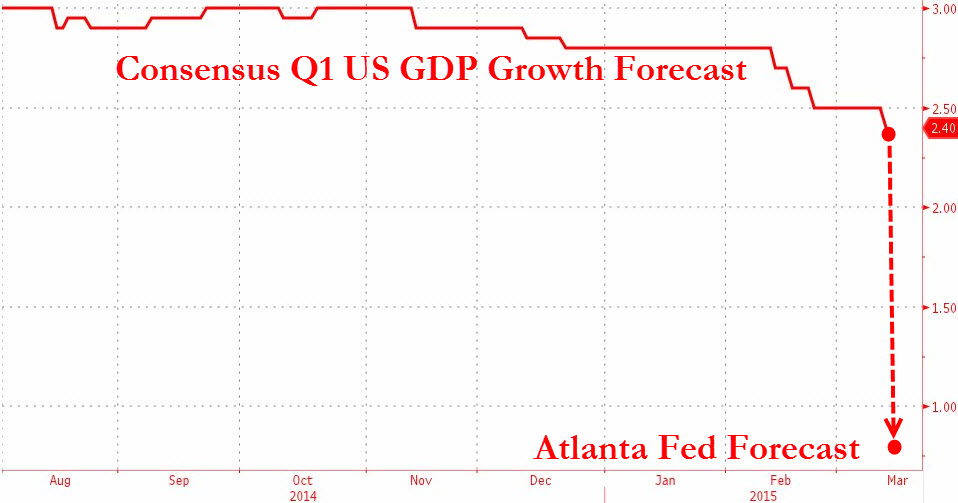
Finally, the GDP Growth consensus is starting to collapse. So much so that if it wasn’t for the QE and zero interest rates, the US Economy would already be in a full out recession (or worse).

Given all of the above, it doesn’t take a genius to figure out what happens next. Surprisingly enough, 99% of investors out there don’t see it.
This conclusion is further supported by my mathematical and timing work. It clearly shows a severe bear market between 2015-2017. In fact, when it starts it will very quickly retrace most of the gains accrued over the last few years. If you would be interested in learning when the bear market of 2015-2017 will start (to the day) and its internal composition, please CLICK HERE.
(***Please Note: A bear market might have started already, I am simply not disclosing this information. Due to my obligations to my Subscribers I am unable to provide you with more exact forecasts. In fact, I am being “Wishy Washy” at best with my FREE daily updates here. If you would be interested in exact forecasts, dates, times and precise daily coverage, please Click Here). Daily Stock Market Update. March 17th, 2015 InvestWithAlex.com
Did you enjoy this article? If so, please share our blog with your friends as we try to get traction. Gratitude!!!

