Continuation of part 4
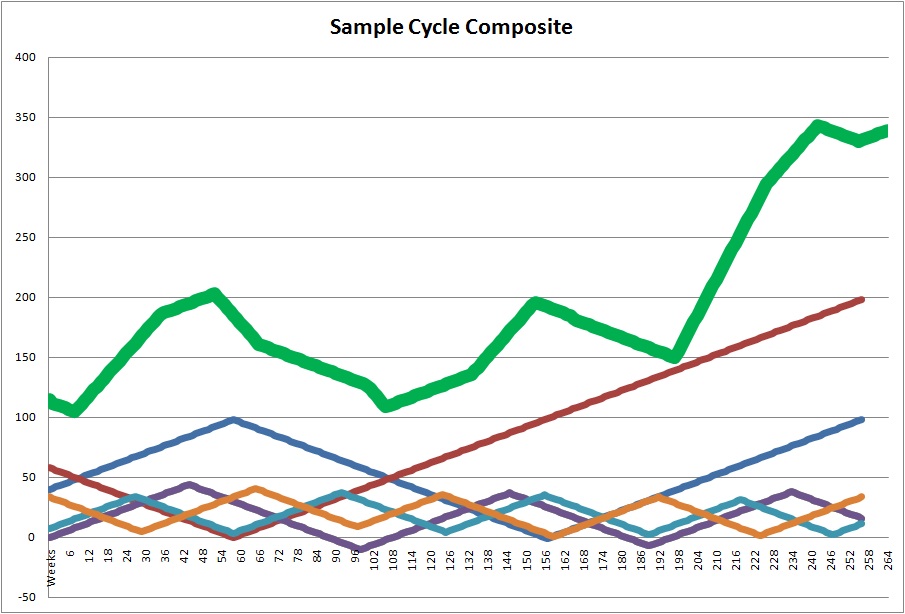
Let us study a sample market composite to gauge full understanding.
This chart requires a little bit of explanation in terms of being able to mimic the actual stock market.
- The chart above represents a sample market composite over a 5 year period of time.
- Please note 5 separate cycles located under the green line. Each line of different color represents a different cycle working over that period of time. Note that these cycles vary in amplitude, and most importantly, in spacing. While some cycles are moving up, others are moving down.
- As these cycles move over time they interact with each other by either diluting each other or by amplifying energy in any particular direction. For instance, major bull moves on the green line occur when most cycles are pointing up.
- As you can see from the chart, all of these cycles started at different points in time.
- The Green Line is the composite cycle of all cycles coming together. It is the summation of all of the moves, either up and down. By combining cycles in such a fashion we come close to mimicking the actual stock market move over that period of time.
- The chart above is one step removed from getting the exact composite. That is done by multiplying the composite above (green line) by the main trend at the time. When we do that properly, we end up with an extremely accurate representation of the stock market.
For instance, an analyst working with this composite would know not only the structure of the upcoming market, but the exact turning points and the length/velocity of any upcoming move. When done with precision, the final output of the composite above should mirror the actual market movements with scary accuracy. Of course, the same type of analysis can be applied to individual stocks. Before we can put together an actual real life composite, it is important that we first take a look and study all of the major individual cycles.
To be continued…..
Did you enjoy this article? If so, please share our blog with your friends as we try to get traction. Gratitude!!!
Timing The Market & Advanced Cycle Analysis

