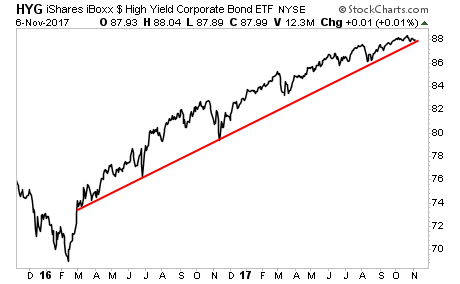
As the chart above suggests and as our analysis indicates, HYG finds itself at a critical juncture. Should it break support, it might signal, for the first time since 2016 rally has started that a bull move in stocks might be coming to an end. Just as well, HYG might be setting itself up for a massive move down. We discuss all of that in our member section. If you would like to find out what happens next, please Click Here
Well, in terms of the stock market, the situation is incredibly complex. If you would like to find out what happens next, based on our mathematical and timing work, please Click Here.
