A positive week with the Dow Jones up 371 points (+1.60%) and the Nasdaq up 154 points (+2.33%)
Having fun yet? As we have been saying, the stock market remains at an incredibly important juncture. Things are about to accelerate in an unexpected way. If you would like to find out what happens next, based on our timing and mathematical work, in both price and time, please Click Here.
Investors were sent into a buying frenzy, with the Dow gaining 746 points, partially by a blow out jobs report. Powell “bending over” was the secondary driver, but let’s save that one for another time.
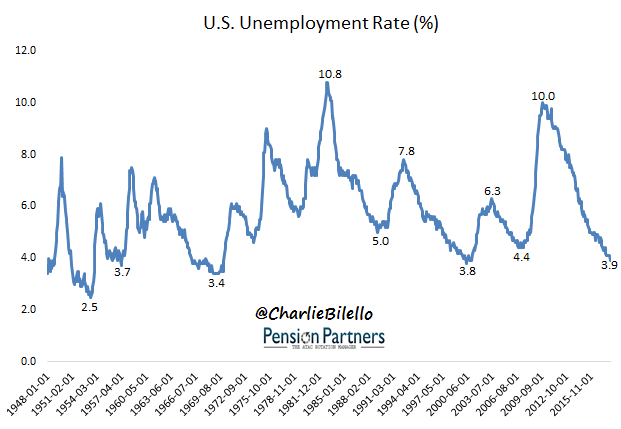
Payrolls Expand by Whopping 312,000 as Unemployment Rate Rises to 3.9%
Seasonally adjusted household survey data have been revised using updated seasonal |adjustment factors, a procedure done at the end of each calendar year. Seasonally |adjusted estimates back to January 2014 were subject to revision.
The change in total nonfarm payroll employment for November was revised up from +155,000 to +176,000, and the change for October was revised up from +237,000 to +274,000. With these revisions, employment gains in October and November combined were 58,000 more than previously reported. (Monthly revisions result from additional reports received from businesses and government agencies since the last published estimates and from the recalculation of seasonal factors.) After revisions, job gains have averaged 254,000 per month over the last 3 months.
In other words, good news is good news again.
Yet, our view is just the opposite. Investors should be horrified of these numbers, not celebrating them. And it has nothing to do with the FED and their interest rate hiking campaign.
Jobs numbers are a lagging indicator, not leading. A quick glance at the history books would reveal a horrifying trend. Record low unemployment and major stock market tops tend to go hand in hand.
Let’s take a look at two charts…..


In other words, when unemployment is at record low levels investors should be preparing for a major move down in the stock market, not celebrating hope and unicorns. The 2000 and 2007 tops are just recent examples. You can go back to 1972 or 1966 or 1929 or 1907 or even 1835 (to name just a few) and get the same reading.
Luckily, you don’t have to be a fool making your investment decisions based on jobs data. If you would like to find exactly what the stock market will do next, in both price and time, based on our timing and mathematical work, please Click Here.
