What Happens When We Hit The Red Region?

We first published this chart over a week ago. Since then the Dow has sliced below its June’s low and is now clearly on the way to the red region outlined below. Now, if you recall, we calculate the market in multidimensional space in order to yield clear Price and Time targets.  

In other words, the Dow should hit the red region below. But that in itself is not very important. What is important is what the market will do next? Will it bounce, will it stage a powerful rally or will it simply shift gears into the next Time/Price point? That’s the billion dollar question at this time…….if I may.  If you would like to find out exactly when/where the red region is hit and, most importantly, what happens thereafter, please Click Here

Buffett Indicator Suggests A Market Crash?

Yet another down day for the market. Nothing unexpected if you follow our work here 

Now, this is the stuff nightmares are made off. According to Mr. Buffett’s own general valuation indicator the market is about to crash…….BIG Time. 

Just look at it, today’s Everything Bubble is twice as big as nearly every other peak that preceded any market crash of importance.  In other words, stocks crazy expensive. Surely the stock market is about to collapse to the tune of 50% + just to reach its historic norm. 

Yet, the analysis above is too simplistic in its nature and doesn’t offer anything in terms of timing. 

For instance, expensive things can get even more expensive and stay there. For instance, 2020-2022 episode is a perfect example. You could have made an argument that stocks are about to collapse based on Buffett indicator alone. They did, “due to covid”, but then quickly recovered to new all time highs where they have been enjoying stratospheric valuation levels ever since. 

Sure, I agree. At some point stocks will collapse. Having said that, before that happens yet another upside surprise might be in the books. If you would like to find out what the stock market will do next and when the next “crash” will occur, please Click Here.  

Short-Term Composition Of The Market Suggests The Following…..

The analysis below is short-term in nature. To be more precise we have to apply longer-term analysis that can be found here……

Let’s take a look at our TIMING variable first. 

Lines below represent cycle clusters that may or may not cause a turning point. That depends on the strength of a timing cluster in question. 

The Time/Price short-term analysis below highlights all possible turning points in both price and time. For instance, a highlighted point indicates the market MIGHT turn around on October 11th at around 12:20 EST at 27,720 on the Dow Jones. Please note, we simply highlighted this point as a sample, not to project. 

The market’s geometric configuration below limits the number of possible outcomes available or associated with this anticipated bottom. 

In summary, when the data points above are combined in an appropriate fashion, you get a very clear picture of where the upcoming Time/Price turning point is. Let’s say to the day and +/- 50 Dow points.  Further, a projection can be made as soon as the said bottom has arrived to estimate the extent of the PRICE and TIME variables of the upcoming rally/bounce. 

So, where and when will this anticipated bottom arrive? Please CLICK HERE to find out. 

Quantum Price & Time Targeting

The calculations above measure the stock market in 3-Dimensions. I highly encourage you to verify our calculations and the data set below to ensure its accuracy. How powerful can this be? Well, assuming you are aware of only this small data set, you would be able to pick out all major tops and bottoms on the Dow, in both price and time, and within 50-100 point or 1-3 trading day resolution.

Move

High Date

High Price

Low Date

Low Price

Change Hours

Change In Price

3D Value

1994/2000

1/14/2000

11,895

11/23/1994

3,612

8,437

8,296

11,832

2000/2002

1/14/2000

11,895

10/10/2002

7,156

4,437

4,727

6,483

2002/2007

10/11/07

14,279

03/12/2003

7,357

7,470

6,882

10,156

2007/2009

10/11/07

14,279

3/6/2009

6,428

2,280

7,811

8,137

2009/2015

5/19/2015

18,351

3/6/2009

6,428

10,050

11,923

15,594

2015/2016

5/19/2015

18,351

8/24/2015

15,332

436

2,981

3,012

Visit Us On TwitterVisit Us On FacebookVisit Us On YoutubeVisit Us On LinkedinVisit Us On Instagram

Last Chance To Sign Up For Our Service Ends On September 1st, 2019

A lot of exciting news going forward. 

First, we are shutting down our Premium Subscriber service to all new subscribers as of September 1st. Going forward our service will be by invitation only. Nuclear war and all.The registration is already closed, but if you wish to subscribe before September please contact jess@investwithalex.com and she will send you a link. 

Second, we will limit updates on this blog to post turning point Time/Price analysis and perhaps irregular political commentary. After all, we live in interesting times and at certain points it is incredibly hard to resist. 

Speaking of, here is what I told my subscribers in regards to Mr. Trump on Aug 21st, 2019. 

As the stock market rallies, the Trump Administration is losing it. Literally. Trump Proclaims Himself the “Chosen One” to Take on China

China is a symptom, if you will, not a problem. The real cause of today’s imbalances lies squarely with the FED and now utterly corrupt US Government. My biggest problem with Mr. Trump is that he fully understands this fact. Yet, he chooses to fight with the shadows while calling some of his “better informed” supporters stupid.

We have a feeling and our stock market work confirms, Mr. Trump will pay dearly for this mistake next November.  And YES, we have made this prediction over 8 months ago. Shocking Forecast Reveals Why President Trump Will Lose 2020 Re-Election Bid

Now, it appears Mr. Trump believes that he can control the stock/bond/currencies/commodities markets and for that matter the world economy with the flatulence coming out of his Twitter account. Or, as some would call it, 10-Dimensional chess. We simply suspect that President Trump will not enjoy being on the receiving end of Mr. Market’s fury. 

Finally, you don’t have to guess what the stock market will do next under today’s extreme conditions. If you would like to find out exactly what the stock market will do next, in both price and time, based on our timing and mathematical work, please Click Here.

Please Note: Our latest call was a direct hit. While everyone was panicking our work projected an important bottom on December 27th (+/- 1 trading day) on the Dow at 21,725 (+/- 50 points). An actual bottom was put in place on December 26th at 21,713.

MAGA? Trump Drives America Towards Insolvency (Weekly Update)

I am simply amazed by the amount of stupidity out there and by the speed with which our society is deteriorating.  

To illustrate, let me ask you a simple question. What did our President comment on today? The fact that the US has officially withdrawn from the INF treaty, bringing us all a GIANT step closer to a nuclear war with Russia (just as my forecast suggests). Or, did he spent time talking about some D list rapper thug. Any guesses? 

I rest my case. 

This week was all about the FED and their interest rate decision. Here is what told my premium subscribers……

A lot of interesting developments in the market today. Let’s concentrate on just two. 

First, the FED doesn’t really know what to do. As I have said before, they are simply following the short end of the yield curve. For instance, the 6 month treasury has dropped from 2.5% at the beginning of the year to about 2.05 today. Hence, the cut we saw today. 

The biggest problem for Powell and the FED, regardless of Trump’s tantrums, is that he doesn’t know what short-term yields will do next. Sure, they can go back to zero, but they can very well blow up again and head towards 5%. Forcing the FED to hike again. That’s the real reason why the FED was “non-committal” today. Just as everyone else, they have no clue. 

Now, the mighty US Dollar blew through an important resistance level today. If you recall, we went long the US Dollar right at the bottom around 89 in early 2018. We got out around 97 some time ago because the US Dollar was hitting an important resistance line at that time. After wrestling with this line for close to a year, today’s market action points towards a breakout. If true, sky is the limit for the USD at this point.  At the very least it will re-test prior highs. 

Throw in the stock market and most traders, understandably, are ripping their hair out. Trying, in vain, to figure out what in the world is going on. 

In terms of the stock market……..

After voting for the guy in 2016, here is what really upsets me about Trump and the whole situation. 

In early 2016 candidate Trump correctly identified a number of important economic/financial issues. To be more precise, he faulted the FED with keeping the interest rates too low for far too long and blowing up massive real estate and stock market bubbles. 

Now that he is the President the exact opposite is true. Apparently the guy wants zero interest rates for even a bigger “Everything Bubble”. 

The following upsets me the most. 

The guy knows or understands very clearly what he is doing or attempting to do.

He is trying to keep the party going a bit longer, no matter the cost or circumstances for the entire country. But the party always ends, and given today’s imbalances, it will get very, very ugly when it does end. So ugly, in fact, that it will devastate the entire country on multiple levels. 

Finally, you don’t have to guess what the stock market will do next under today’s extreme conditions. If you would like to find out exactly what the stock market will do next, in both price and time, based on our timing and mathematical work, please Click Here.

Please Note: Our latest call was a direct hit. While everyone was panicking our work projected an important bottom on December 27th (+/- 1 trading day) on the Dow at 21,725 (+/- 50 points). An actual bottom was put in place on December 26th at 21,713.

Zero Interest Rates & Infinite Valuation Levels (Weekly Update)

Well, this is getting rather entertaining. Here is how I would describe the state of the US/Global economy in real terms. 

The US Economy is like a Boeing 737 Max. The geniuses who have designed it are mostly all on board and partying hard. Captain Trump just maxed out the throttle with corporate tax cuts (mostly channeled into stock buybacks), massive/historic deficit spending, back to zero interest rates promises and who could forget…….a lot of BS.

The issue is, the plane is flying straight into a massive mountain and is way too heavy to get over it. 

Of course, the biggest news over the last few weeks had to do with the FED and Mr. Powell turning into a full on “Dove”.  To most traders out there that means interest rates eventually going back to zero or below, QE, etc…..  Hence, the party can continue and the rally we saw off of May lows is very much justified. 

Indeed, the time to load up on call options might be at hand. After all, even Warren Buffett has suggested in the past that stocks deserve infinite valuations if interest rates are at zero (Google it). 

Here, however, lies the biggest issue. Just because interest rates being at zero fueled the current bubble, doesn’t mean them going back to zero will continue the trajectory. For all we know, the bubble might eventually collapse under its own weight. 

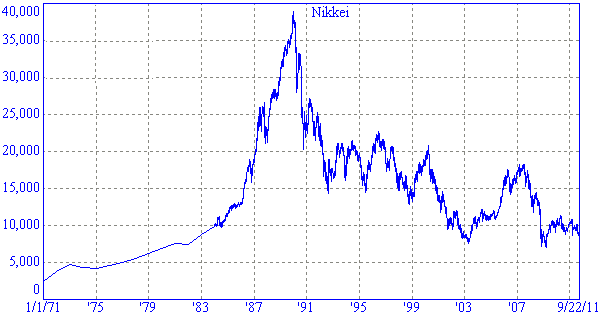
And YES, I have prove. Here is the chart of Nikkei 225 (with interest rates below 1% since 1995). 

So, should you prepare for the worst bear market in human history, as some prominent bears have suggested -OR- should you be stuffing your brokerage account with all sorts of call options?

Well, if you would like to find out what the stock market will do next, based on our timing and mathematical work, in both price and time, please Click Here

This Week’s Journal consists of the following topics 

Finally, you don’t have to guess what the stock market will do next under today’s extreme conditions. If you would like to find out exactly what the stock market will do next, in both price and time, based on our timing and mathematical work, please Click Here.

Please Note: Our latest call was a direct hit. While everyone was panicking our work projected an important bottom on December 27th (+/- 1 trading day) on the Dow at 21,725 (+/- 50 points). An actual bottom was put in place on December 26th at 21,713.